Santa Barbara South County MLS Statistics For May 2025
Real Estate Market Update
Here are the SB MLS Statistics for May 2025: https://sbaor.org/clientuploads/2025/Stats/May_2025_stats.pdf
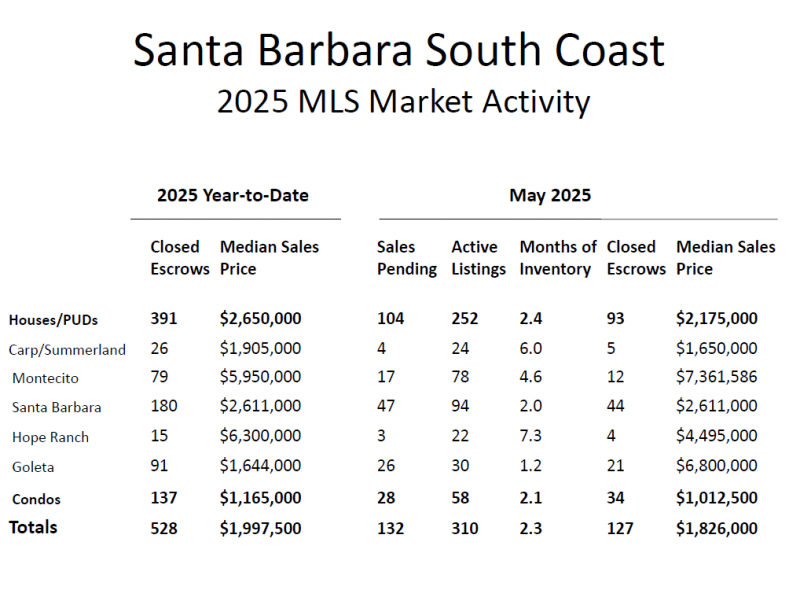
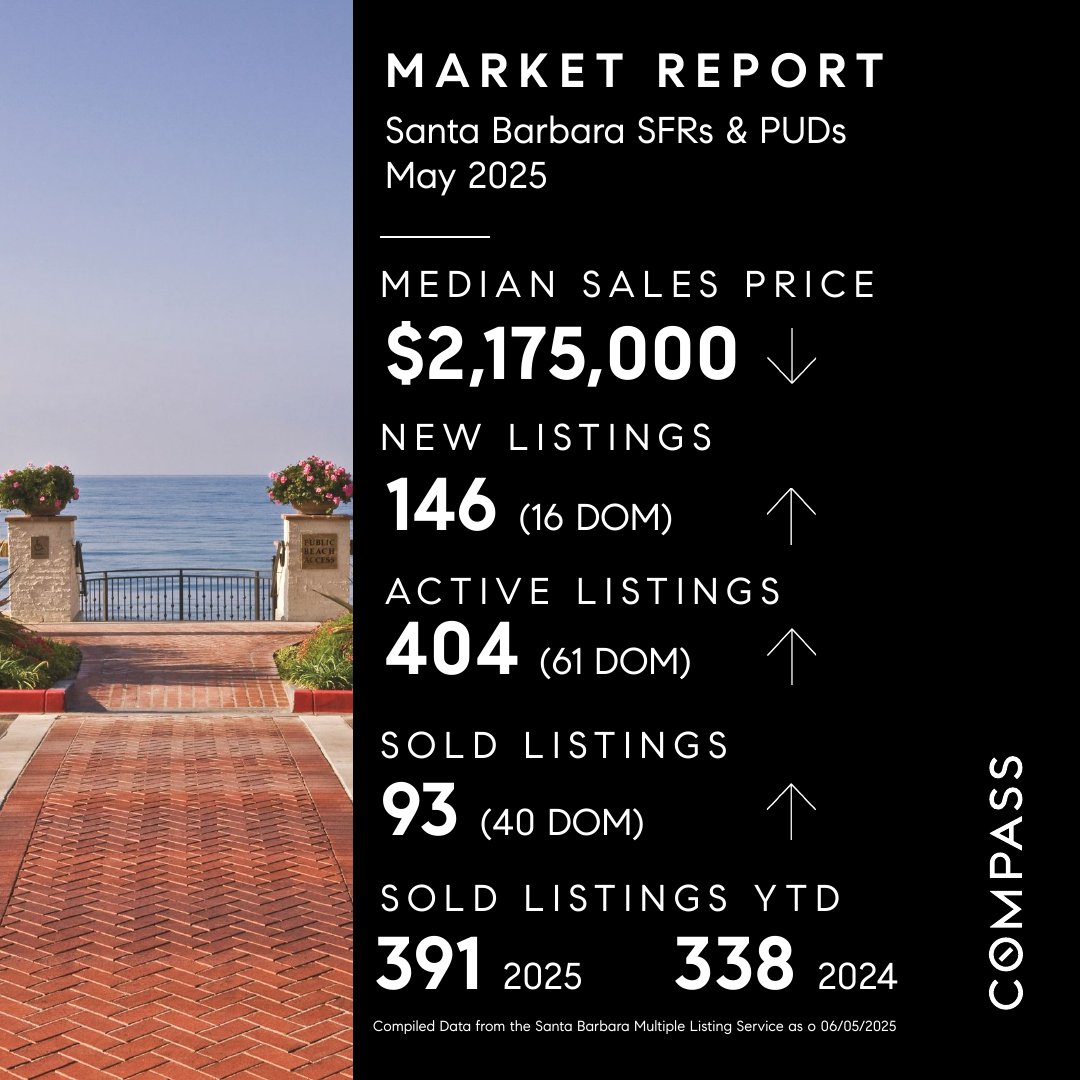
May 2025 Market Recap in Santa Barbara South County
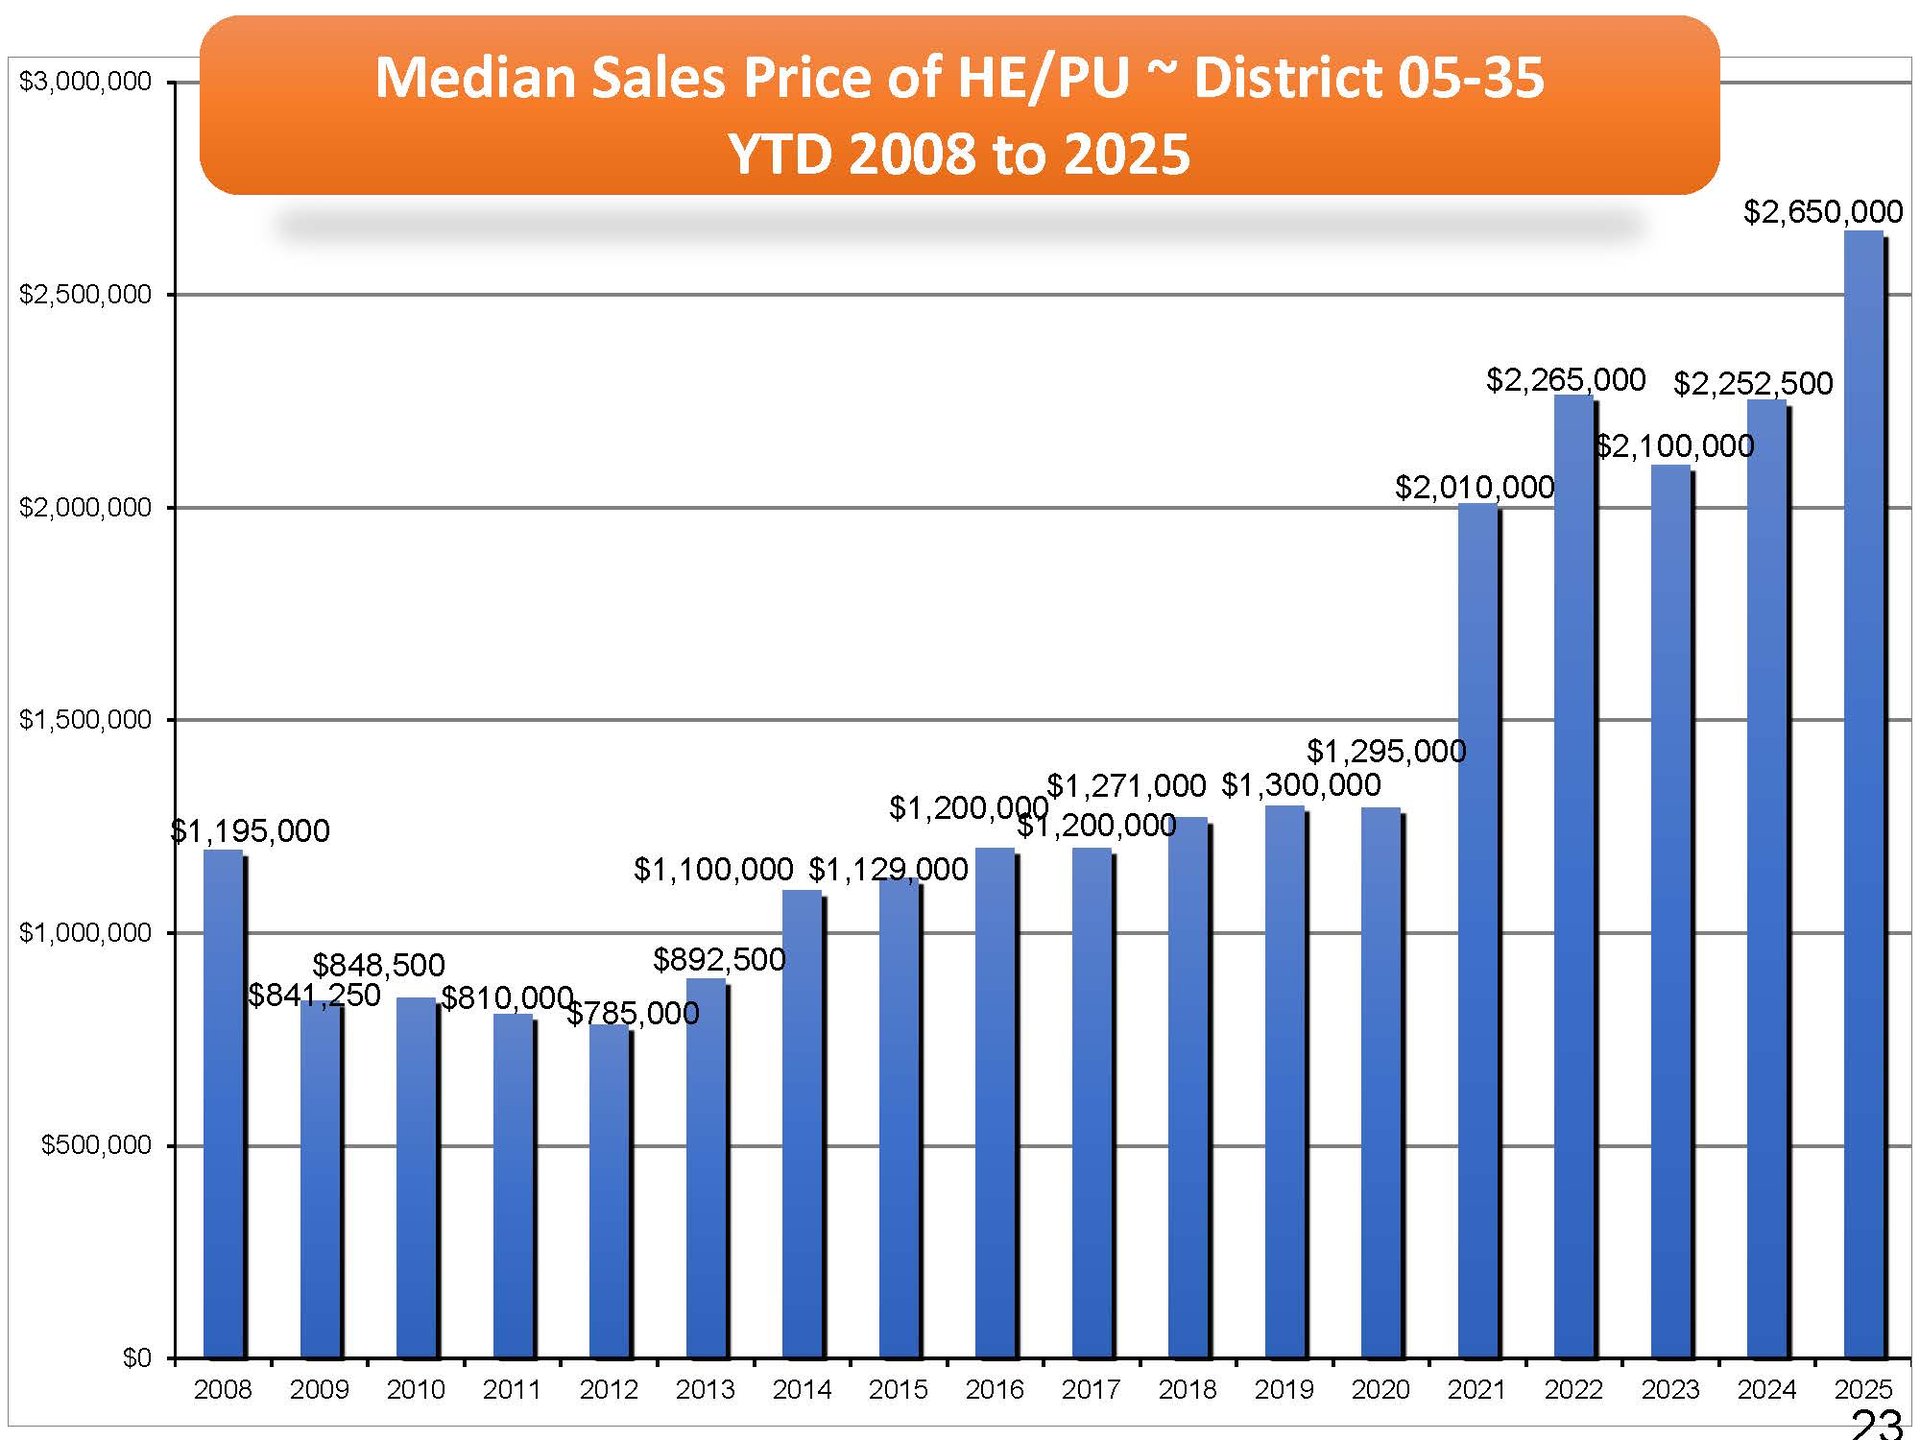
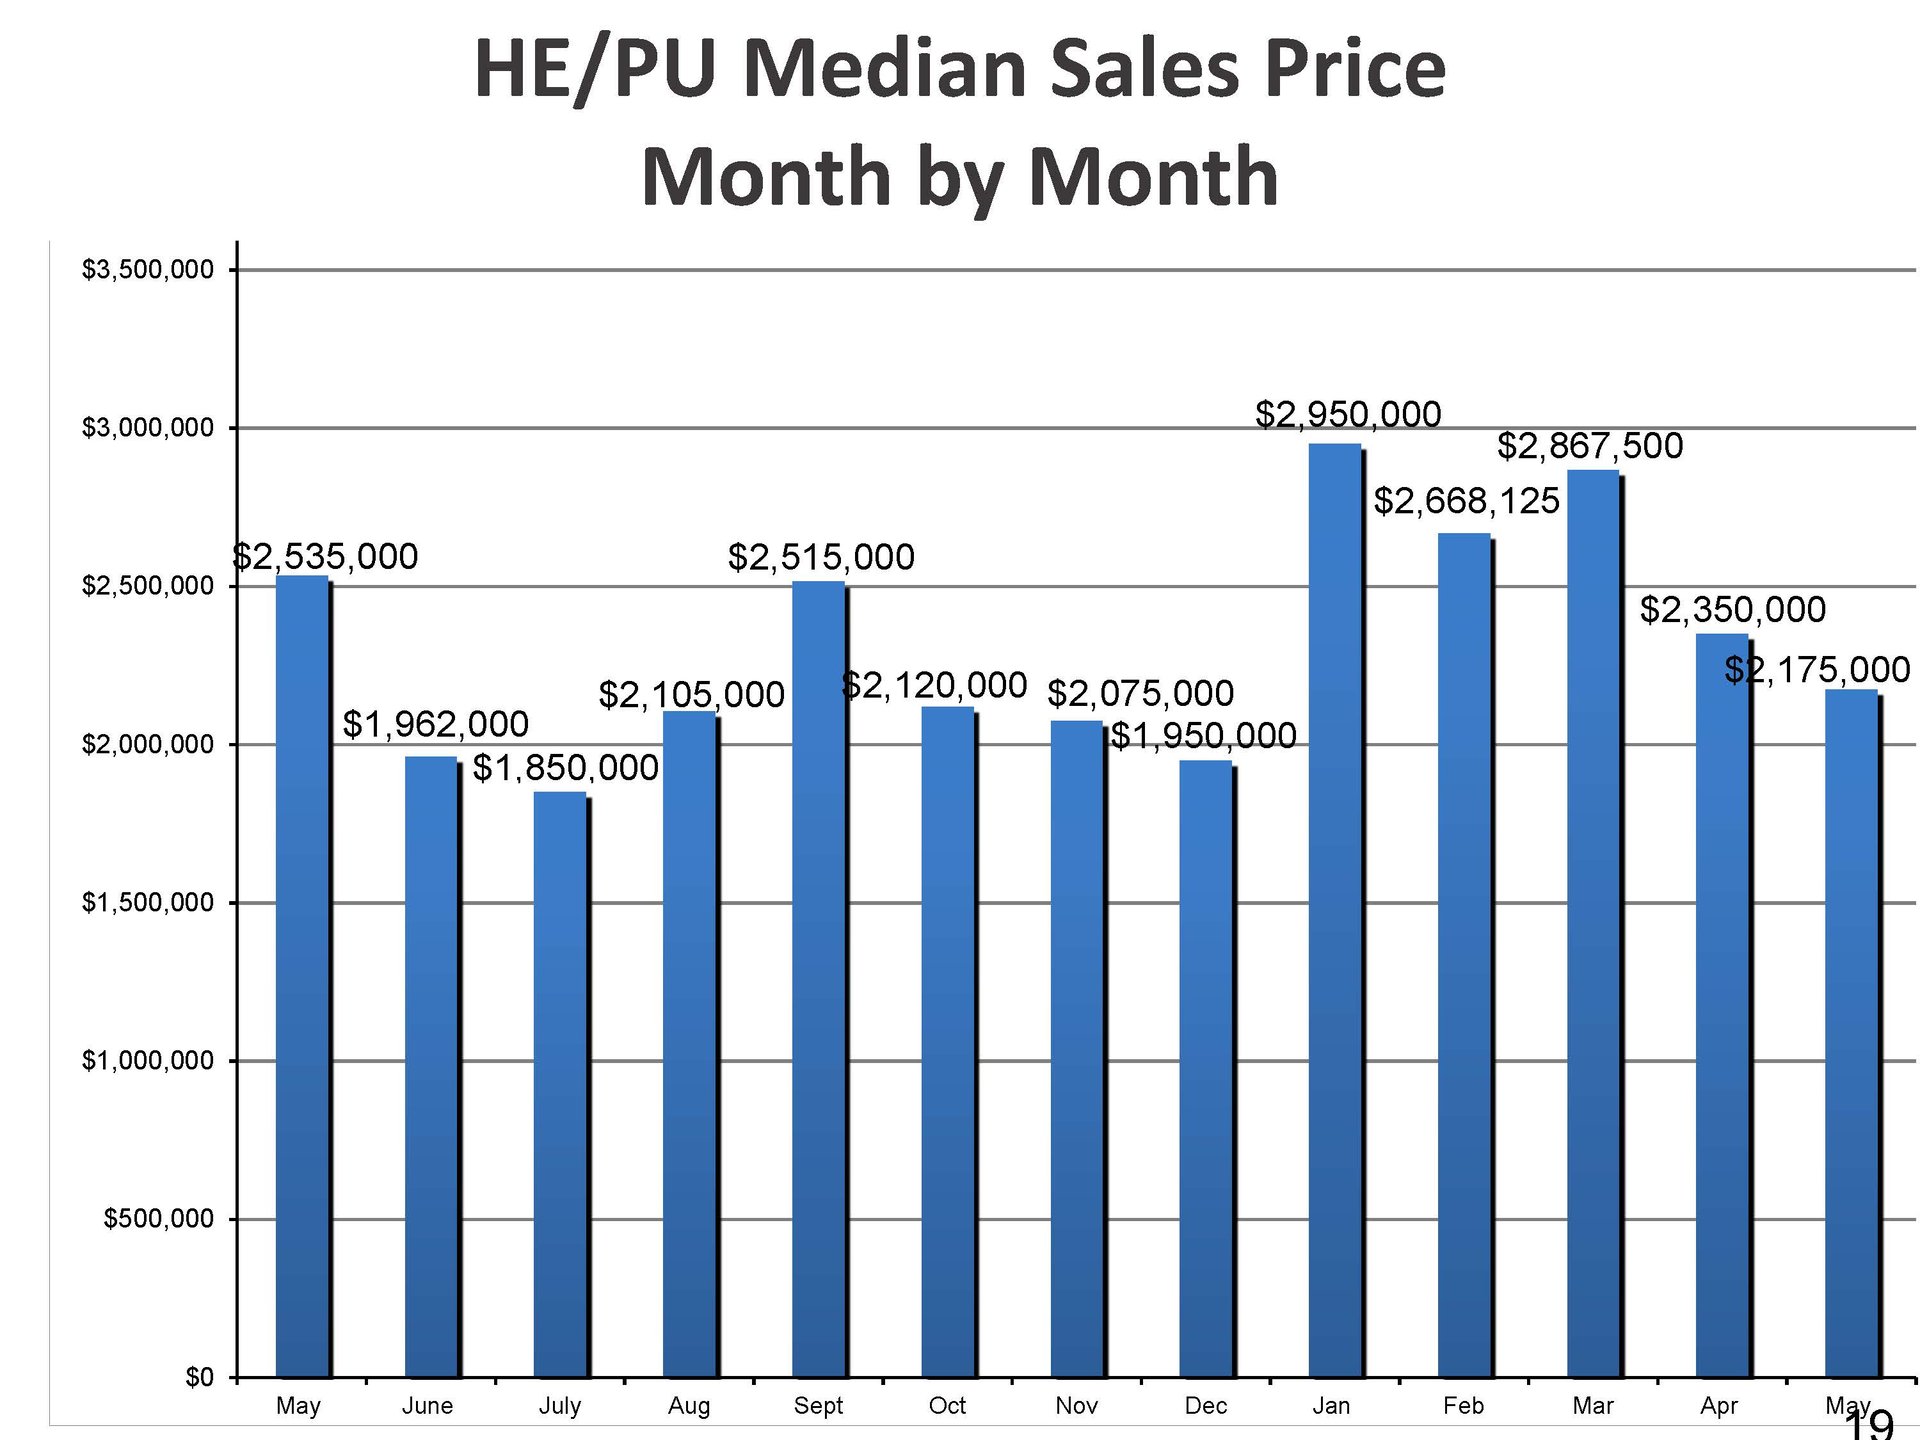
• Median home price $2.10 M (–3% YoY)
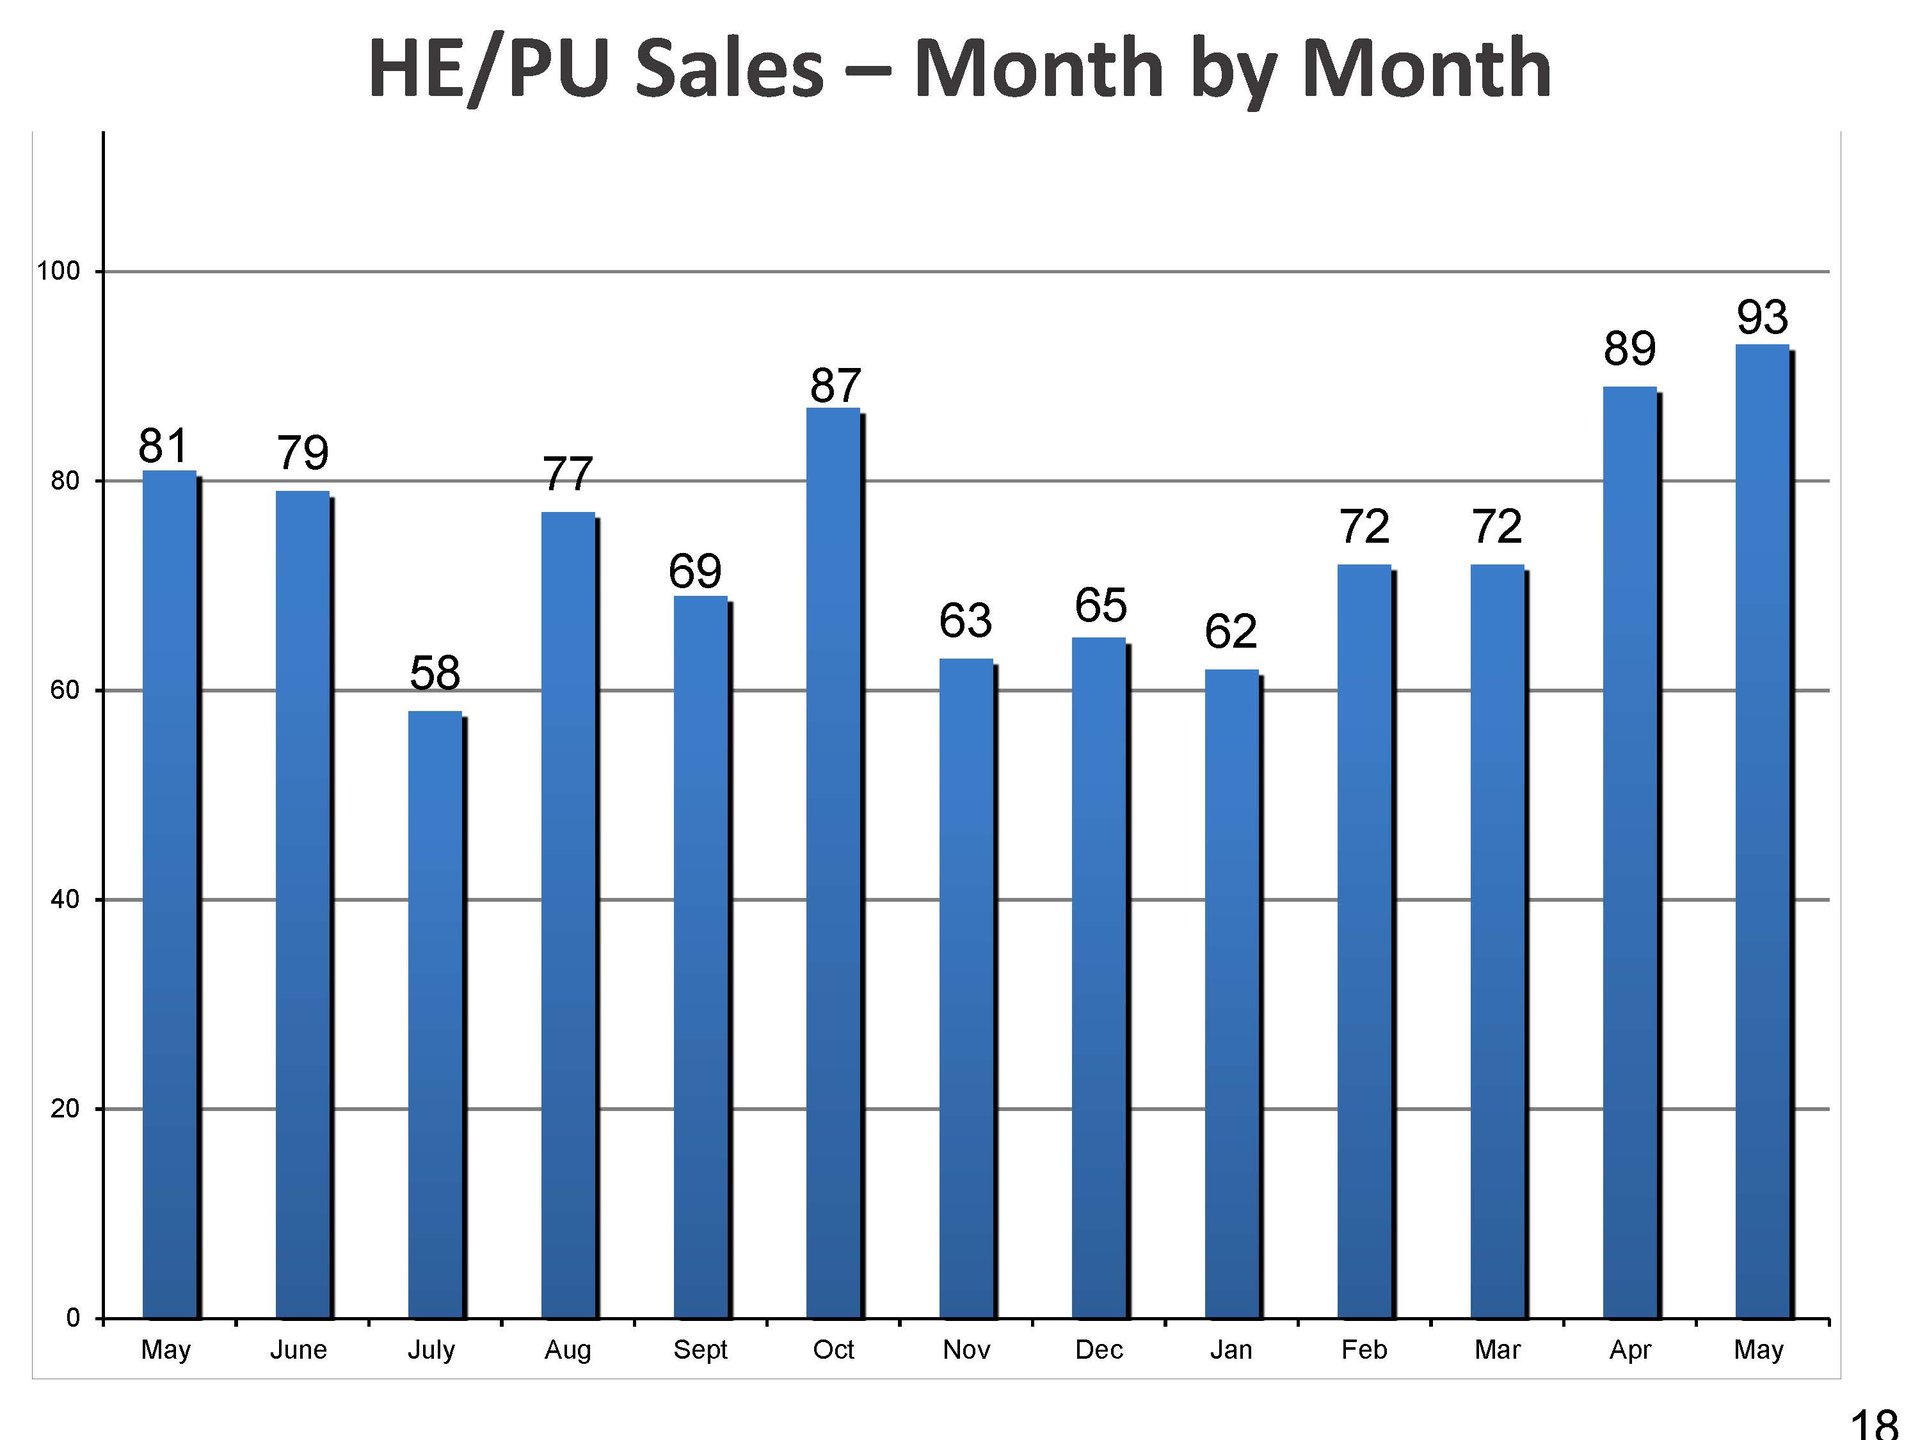
• ~404 listings (+9% MoM) • 93 closings (–4% vs April)
• Homes sell in ~40 days
• Condos shine: +24% YoY
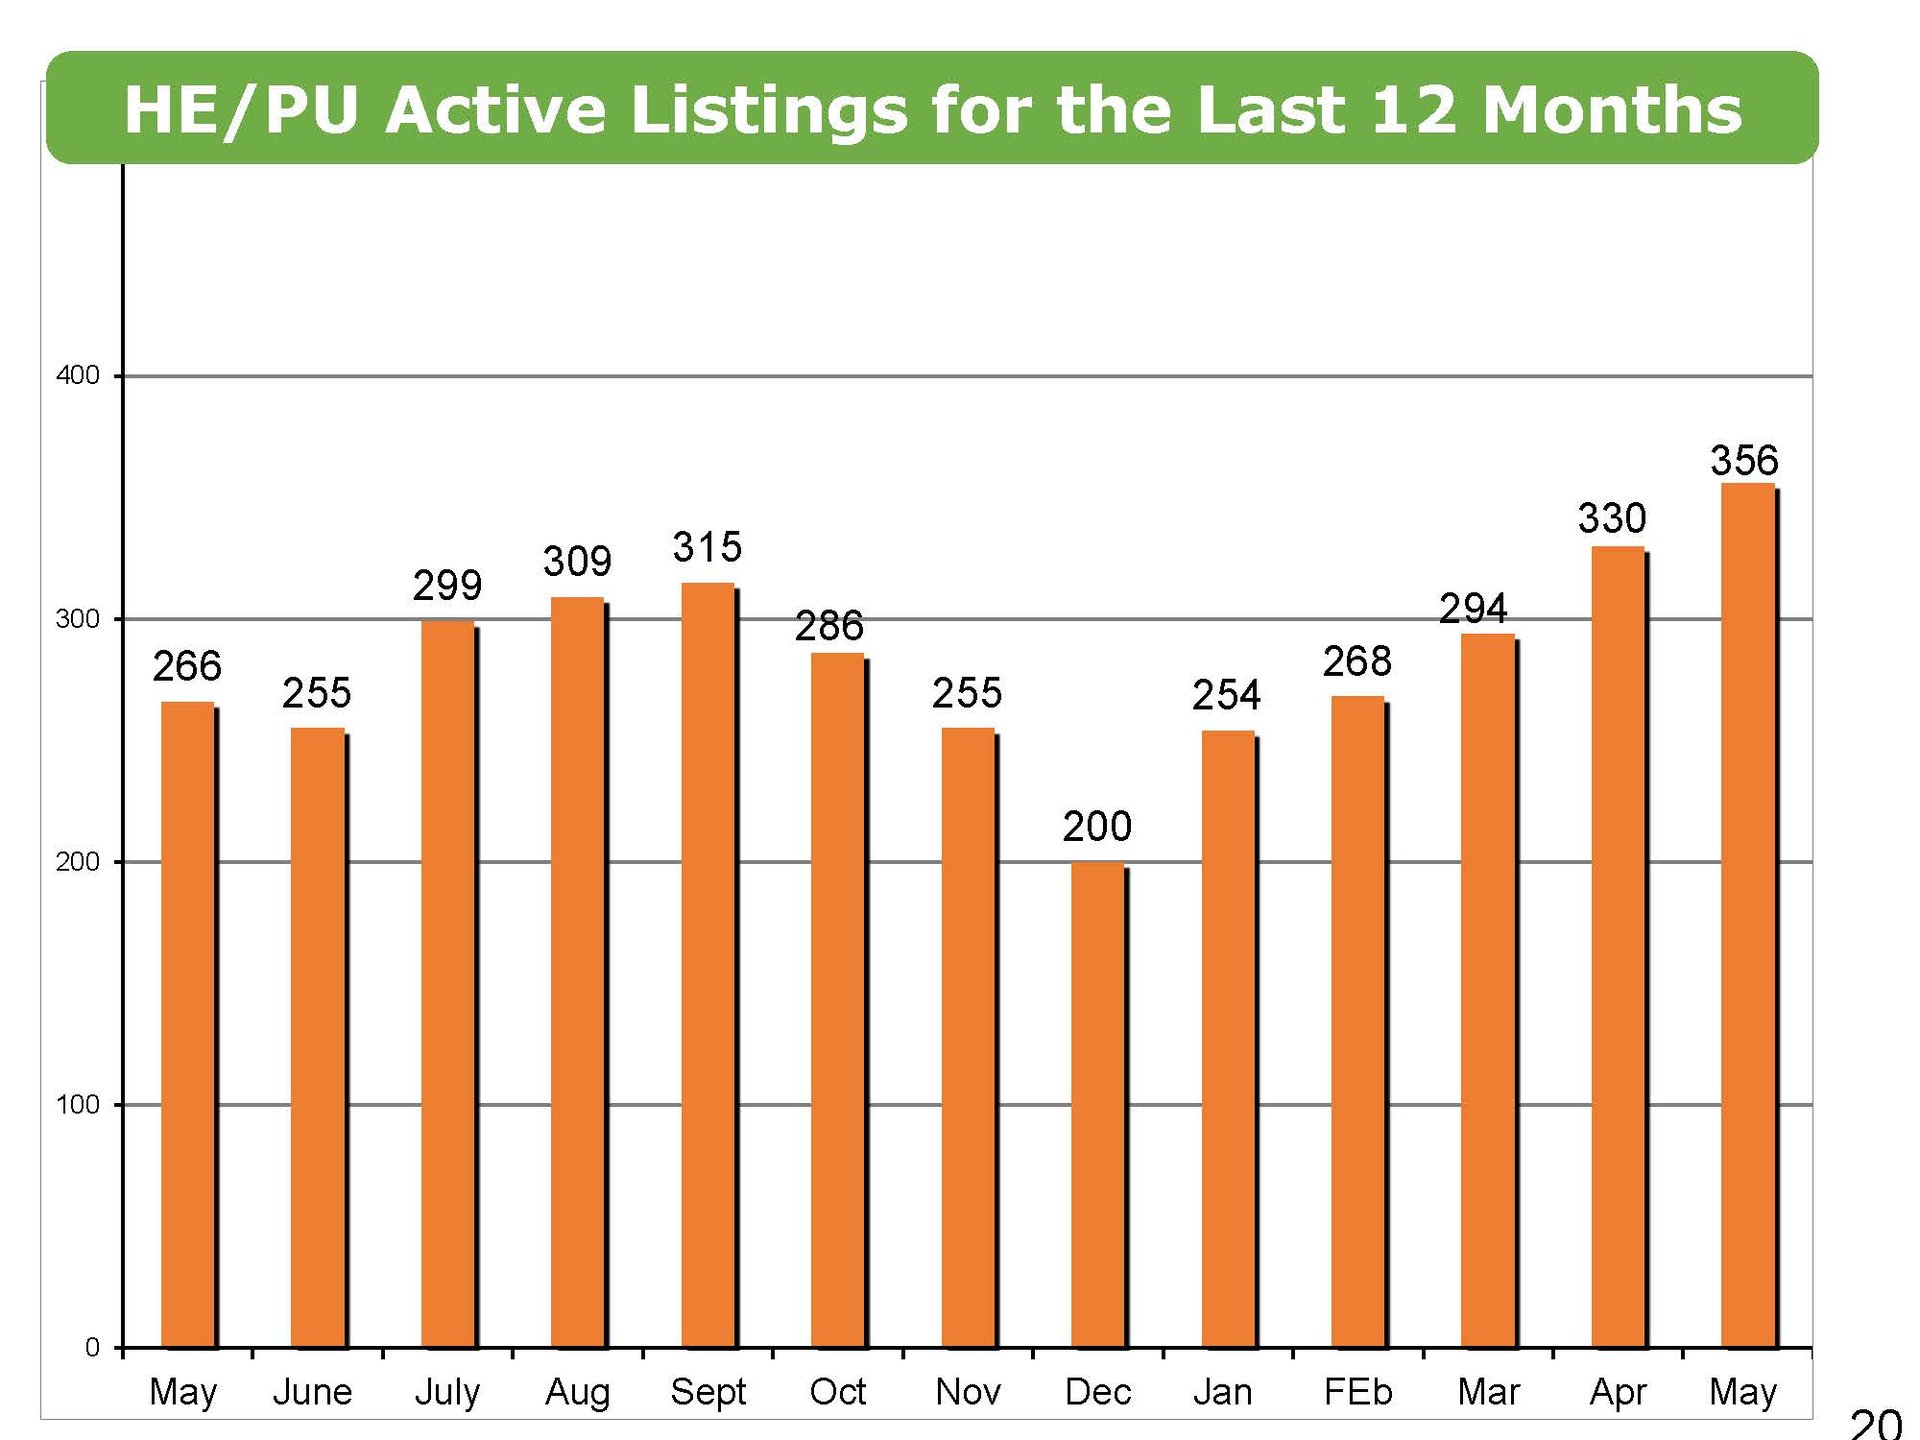
• Inventory rise—especially 4‑5 bed • Luxury market softens ✔️
🧭 Tip for buyers: Get pre‑approved and act quickly.
💼 Sellers: Staging and pricing right are your keys to top offers.
Santa Barbara South County Active Listings for the Last 12 Months

Santa Barbara South County Number of Homes, Estates, and PUDs Sales Year-to-Date 2008 to 2025
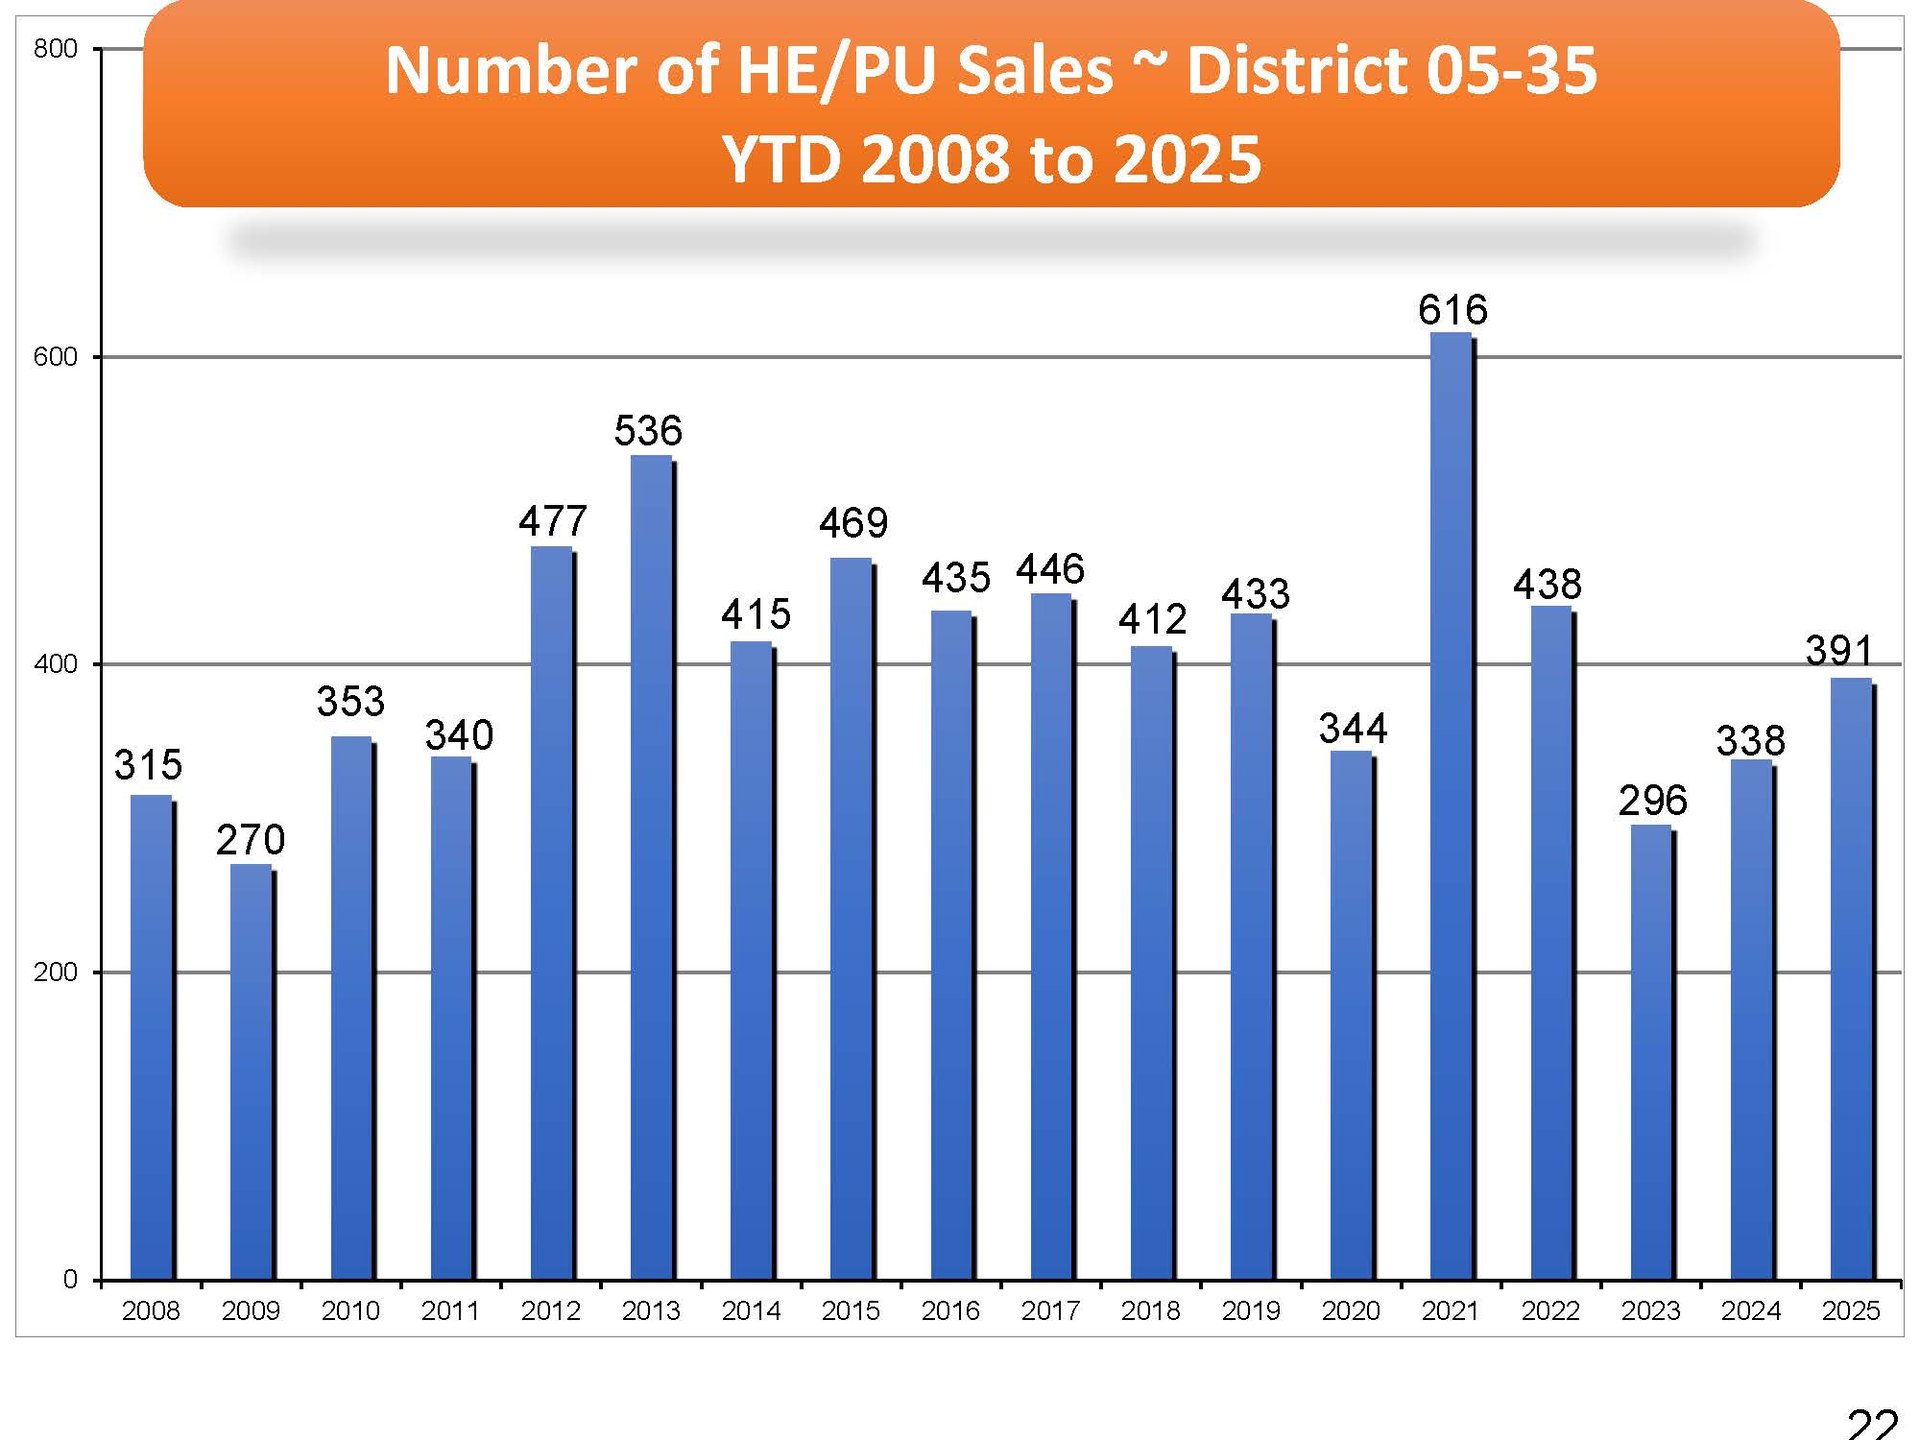
Santa Barbara South County Homes, Estates, and PUD Sales - Year-to-Date 2008 to 2025
Santa Barbara South County Homes, Estates, and PUD Sales - Month by Month
Santa Barbara South County Home, Estates, and PUD Median Sales Price - Month by Month
Santa Barbara South County Home, Estates, and PUD Active Listings for the Last 12 Months
Contact us to receive a link to the in-depth Fidelity Title Report Santa Barbara, Montecito & Hope Ranch monthly and year-to-date statistics.
Call, text or email today!
(805) 284-3660
[email protected]