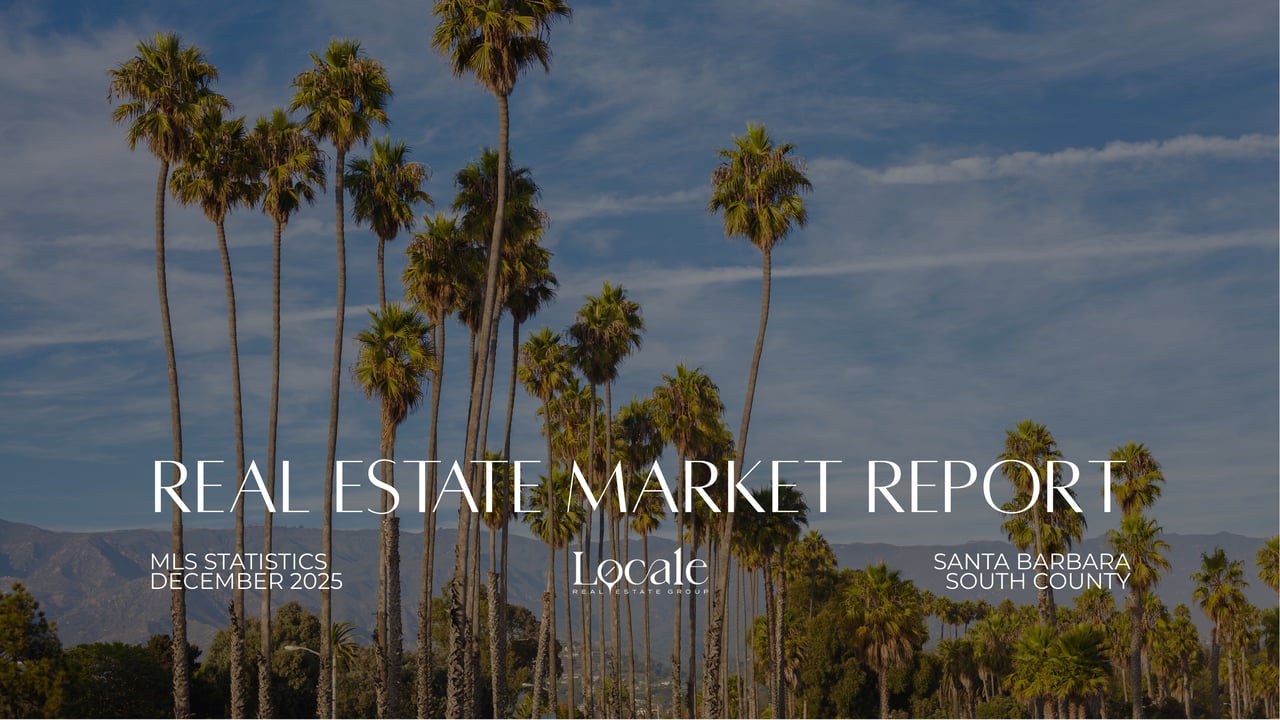
Santa Barbara South County MLS Statistics For December 2025
Real Estate Market Update
Here is the SB MLS Statistics for December 2025: SBAOR Monthly MLS Statistics - December 2025
The Santa Barbara real estate market concluded 2025 with significant year-over-year growth in both activity and pricing. Data compiled by the Santa Barbara Association of REALTORS® (SBAOR) through December 31, 2025, reveals a landscape defined by rising inventory and robust sales volume, indicating a market that remains highly desirable despite broader economic shifts. For homebuyers, this year-end data provides essential context for navigating a more populated but still competitive marketplace as we transition into 2026.
Macro Market Performance
The overall market for residential properties demonstrated a significant expansion in supply and financial volume throughout 2025 compared to 2024. This growth reflects a healthy increase in both new properties entering the market and the total capital moving through the local real estate sector.
Sold Volume Growth
Total sold volume for home estates and PUDs reached $3,448,437,278 in 2025, marking an 18.3% increase from the previous year.
Rising Inventory Levels
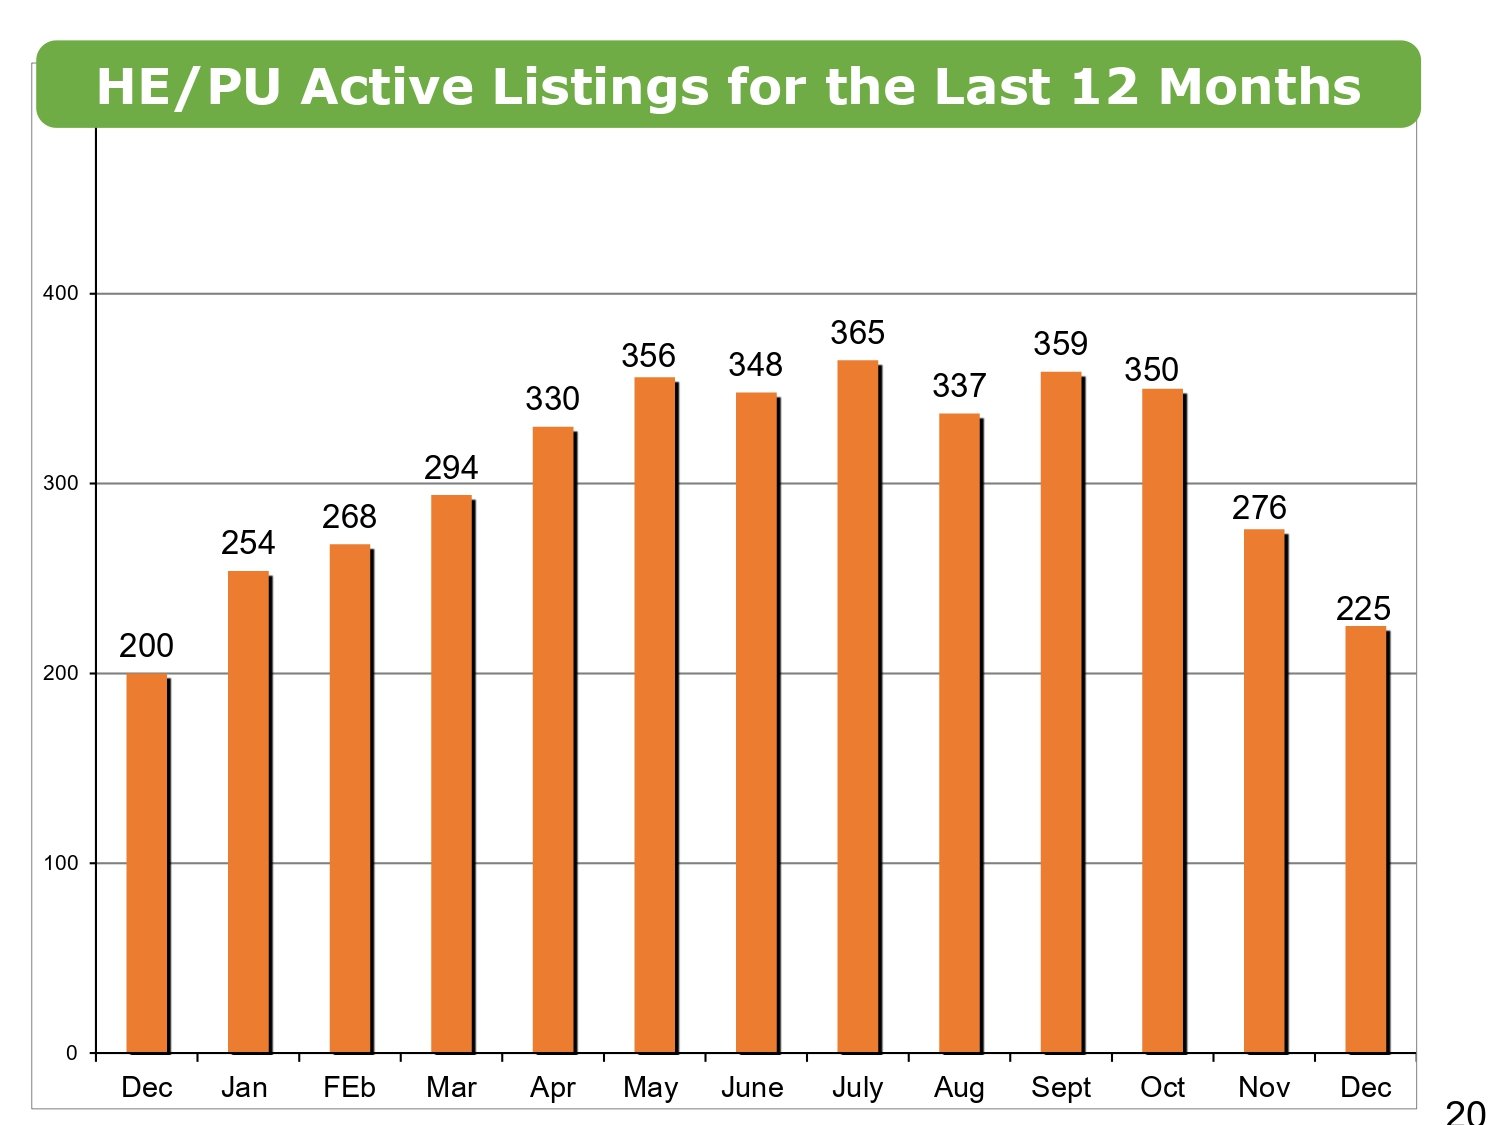
Total active listings grew to 1,137, which is a 15% increase over the 989 listings available at the end of 2024.
New Listing Surge
Fresh inventory increased by 15.6% year-over-year, with 1,351 new properties listed during 2025 compared to 1,169 in 2024.
Escrow Activity
The number of properties that went into escrow rose to 970, a 14.1% increase from the 850 recorded in the prior year.
Single-Family Home Trends
Single-family residences continue to lead the market, characterized by consistent sales activity and steady price appreciation. While the overall year saw prices rise, December specifically showed a more localized and conservative pricing trend compared to the same month last year.
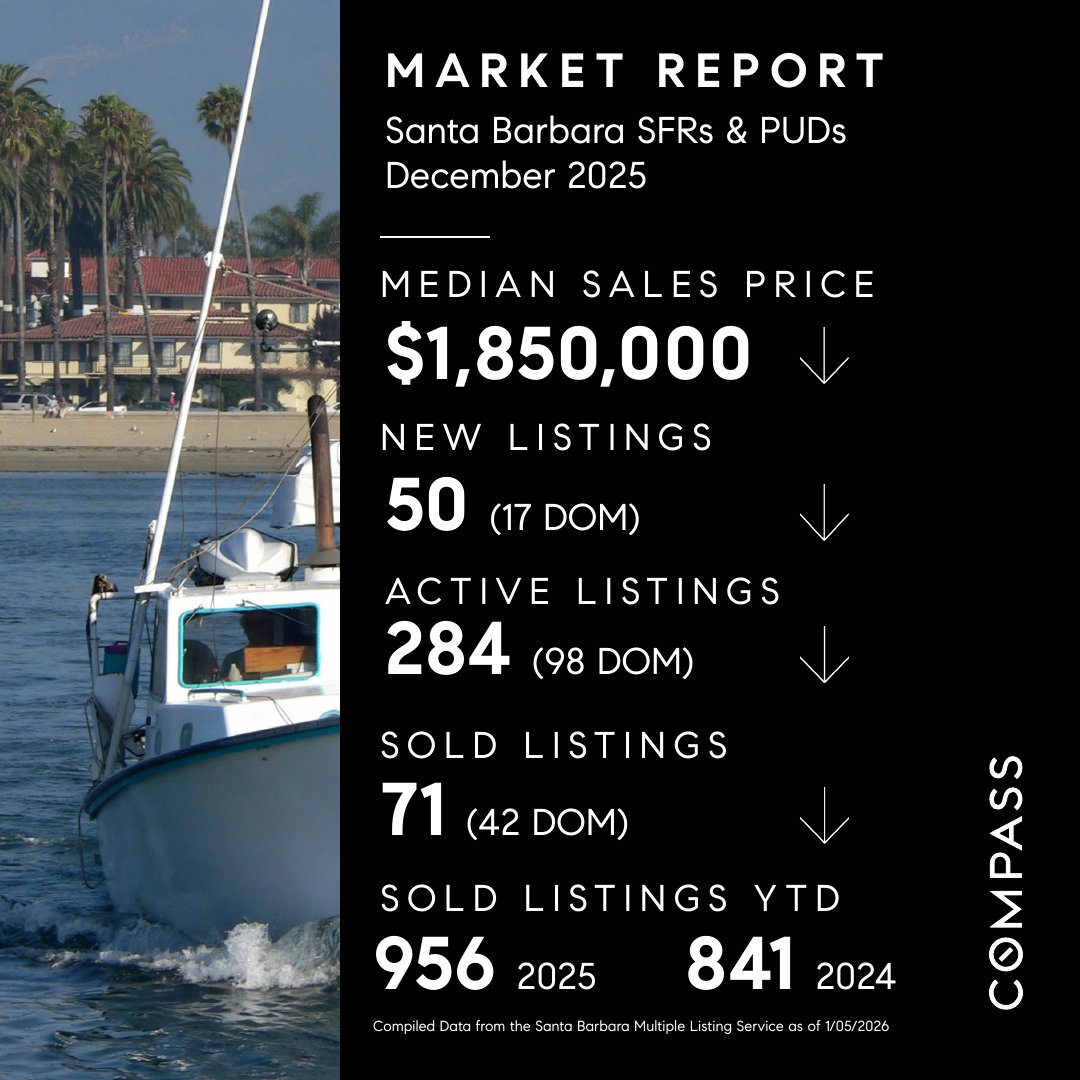
The single-family home market remains the core of Santa Barbara’s residential activity, with 956 total sales recorded in 2025. The following figures highlight the specific pricing dynamics and market speed observed at year-end:
Annual Median Price
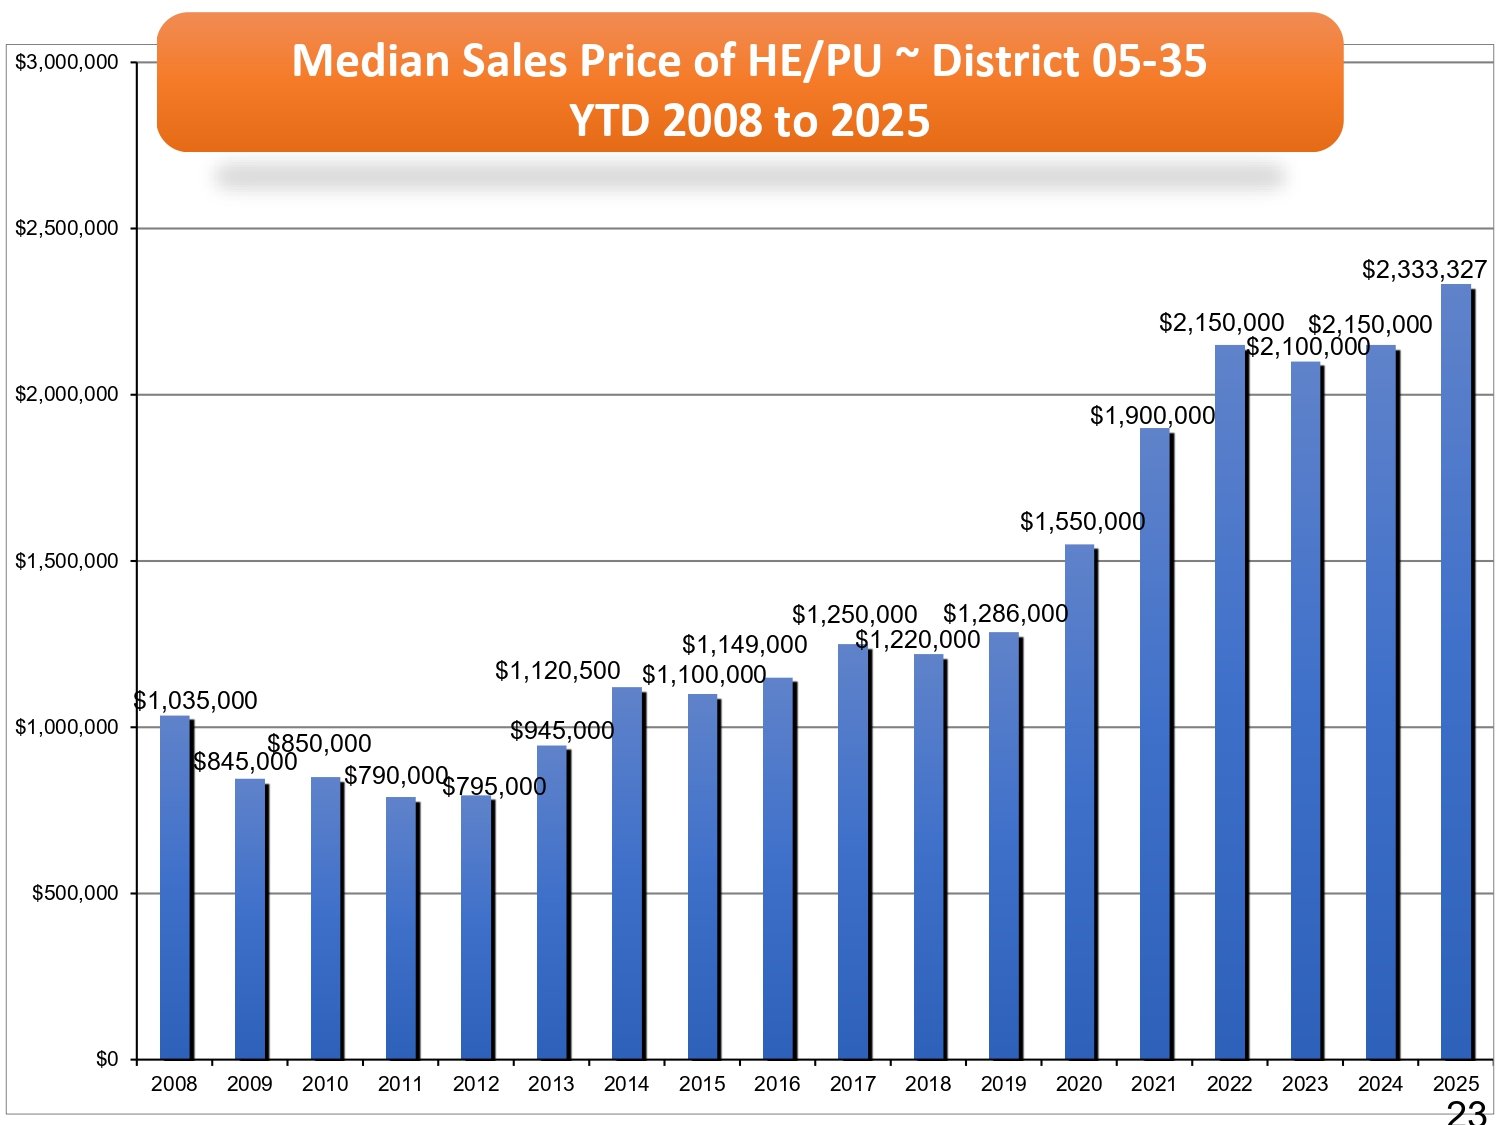
The year-to-date median sales price reached $2,333,237, an 8.5% increase over the $2,150,000 median in 2024.
Localized Price Growth
When excluding luxury areas like Montecito and Hope Ranch, the median sales price was $1,980,000, representing a more modest 3.6% increase.
December Pricing
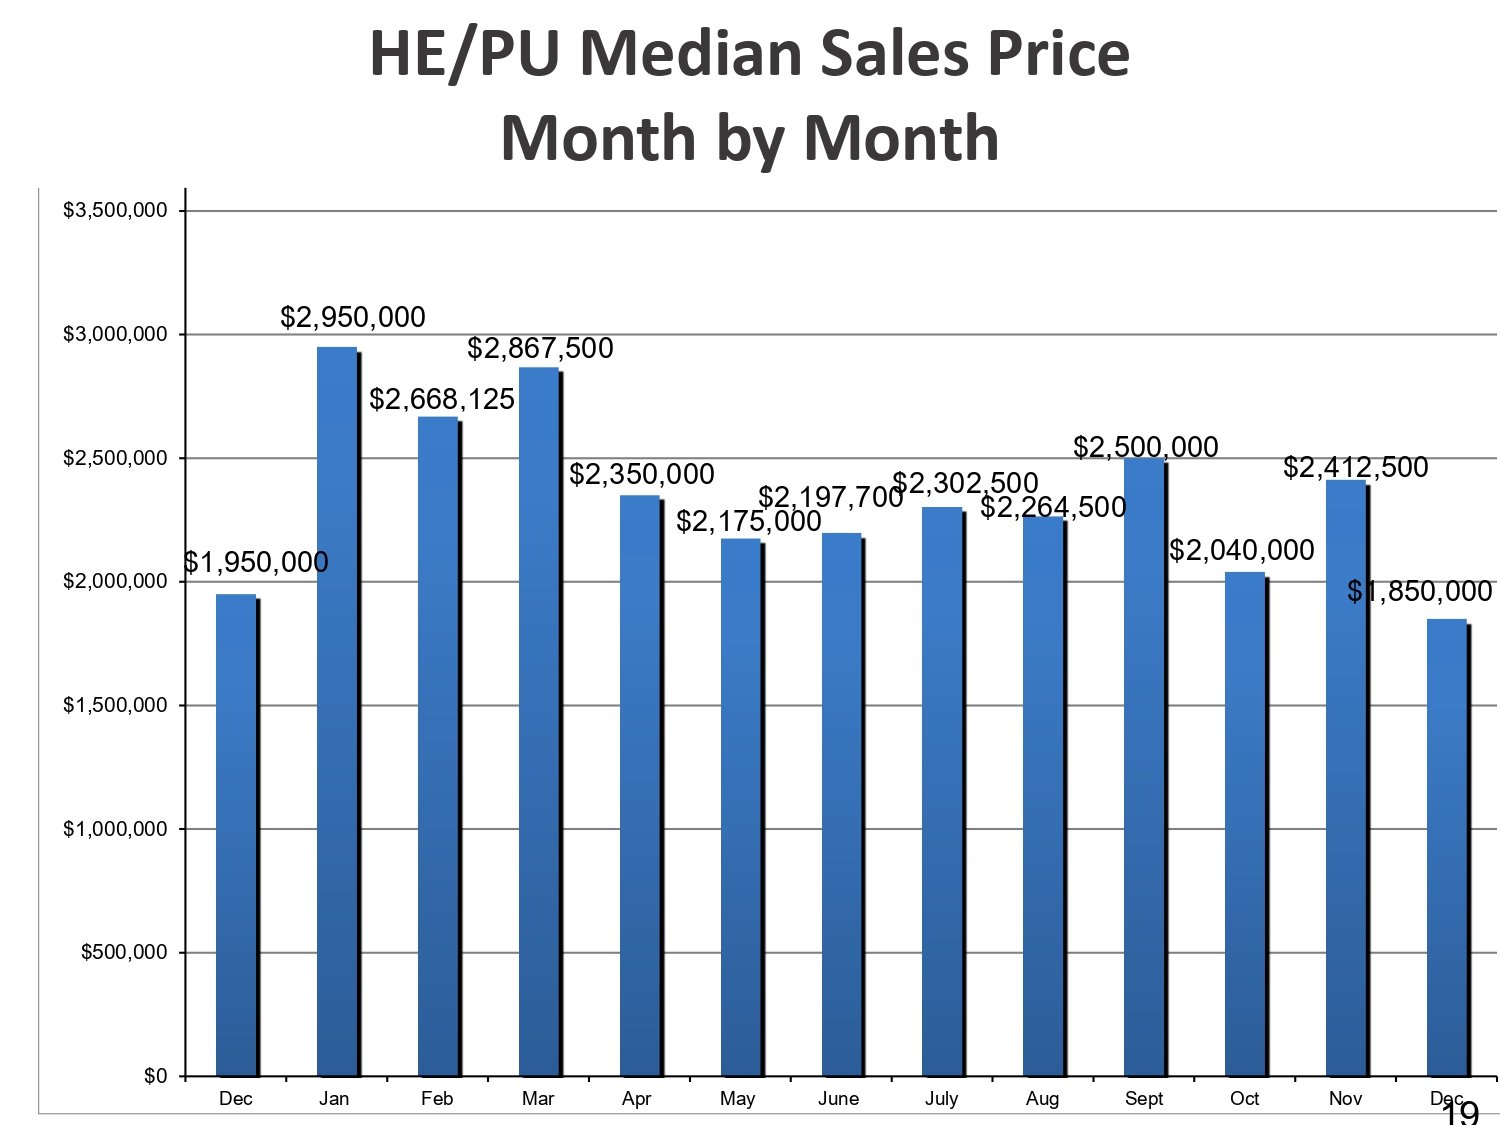
The median sold price for the month of December was $1,850,000, a slight decrease from the $1,950,000 median recorded in December 2024.
Market Velocity
Properties sold in December spent an average of 42 days on the market (DOM), nearly identical to the 43-day average seen in December 2024.
Pricing Accuracy
Sellers achieved an average sales-price-to-list-price ratio of 94.62% in December, showing that buyers are still paying close to the asking price.
The Condo Market
The condo segment saw some of the most dramatic percentage increases in inventory and sales volume during 2025. This sector serves as a vital entry point for many homebuyers, offering a growing number of options at a lower median price point than single-family homes.
The condo market experienced a notable 18.3% increase in total sold volume for the year, matching the growth rate seen in the single-family home sector. This segment is increasingly active, as evidenced by the following 2025 year-end statistics:
Sales Volume Total
Total sold volume for condos in 2025 reached $424,103,919, up from $358,526,651 in 2024.
Condo Median Price
The year-to-date median sales price for a condo was $1,041,500, which is a 4.7% increase from the previous year.
Inventory Expansion
Active condo listings grew by 18%, reaching 374 units in 2025 compared to 317 in 2024.
New Listing Growth
New condo listings jumped by 20.1% for the year, with 430 units entering the market.
December Highlights
20 condos were sold in December with a median price of $955,000 and an average of 44 days on the market.
Homebuyer Insights
Analyzing activity within specific price ranges can help buyers understand where the market is most competitive. December’s data reveals a "sweet spot" for activity in both the single-family and condo markets.
Activity remains concentrated in the mid-market price points, where the highest number of transactions occurred during the final month of the year. Buyers can use these concentrations to gauge the competition they might face:
Single-family home sales were strongest in the $1,500,000–$1,599,999 range, while the luxury segment remained active with multiple $5,000,000+ transactions and longer days on market.
Condo activity was most concentrated in the $850,000–$899,999 range, with overall December prices spanning from just over $1,000,000 to more than $17,000,000.
Strategic Outlook for 2026
As we move into 2026, the Santa Barbara market remains a high-demand environment with more liquidity than in previous years. The double-digit increases in both active listings and properties entering escrow (up 14.1%) suggest a market that is gaining momentum as it moves toward the spring season. Buyers should be encouraged by the 15% growth in total inventory, which offers more choice and potentially more leverage in negotiations than was available at the end of 2024.
Santa Barbara South County Home Estates, and PUD Active Listings for the Last 12 Months
Santa Barbara South County Number of Homes, Estates, and PUDs Sales Year-to-Date 2008 to 2025

Santa Barbara South County Homes, Estates, and PUD Sales - Year-to-Date 2008 to 2025
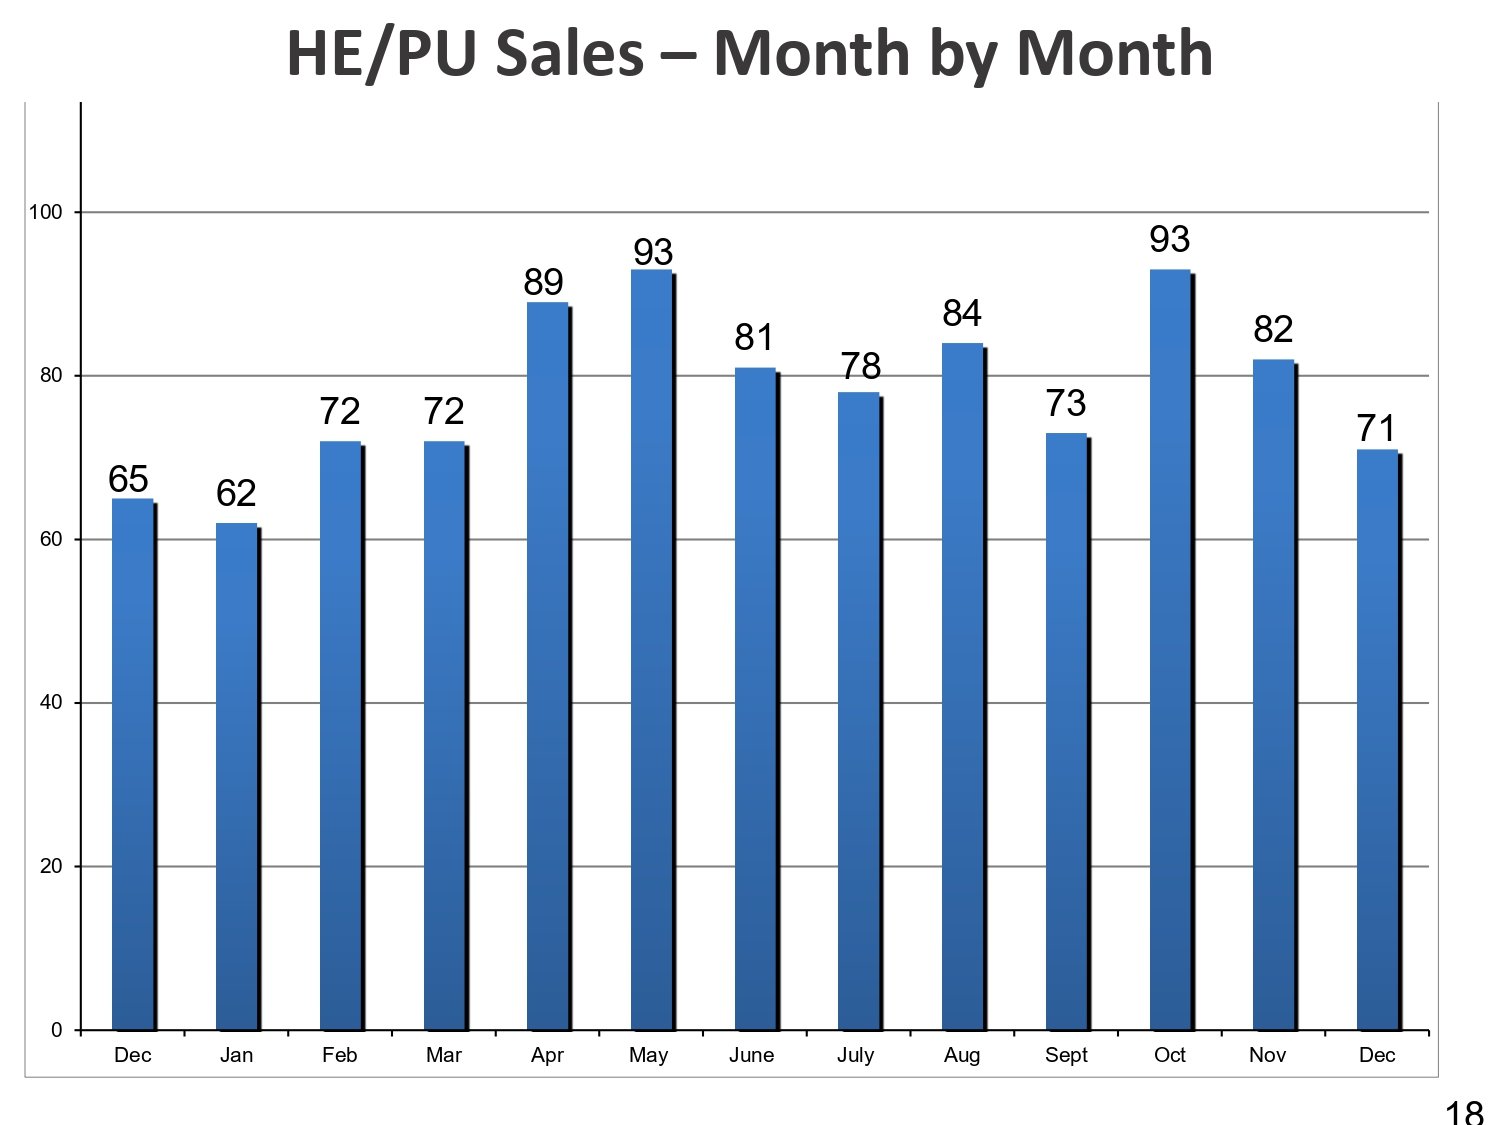
Santa Barbara South County Homes, Estates, and PUD Sales - Month by Month
Santa Barbara South County Home, Estates, and PUD Median Sales Price - Month by Month
Make Informed Decisions in the Santa Barbara and Montecito Luxury Market in 2026
2026 brings new opportunities and new considerations across the Santa Barbara and Montecito markets. The strongest outcomes come from informed decisions, thoughtful timing, and trusted local expertise. We’re here to support you every step of the way.
M: (805) 284-3660
E: [email protected]