Santa Barbara South County MLS Statistics For January 2026
Real Estate Market Update
Here is the SB MLS Statistics for January 2026: SBAOR Monthly MLS Statistics - January 2026
The Santa Barbara South County residential real estate market entered the new year with a transition characterized by decreased transaction volumes and a cooling of median sales prices. Data compiled by the Santa Barbara Association of REALTORS® (SBAOR) as of February 5, 2026, reveals that both the single-family home and condominium sectors experienced a decline in total sold volume compared to the previous year. This analysis details the inventory shifts and pricing trends observed across Districts 05-35 during the month of January.
Deep Dive into Single-Family Home Trends
The single-family home sector recorded 57 sales in January 2026, representing an 8.1% decline from the 62 sales finalized in January 2025. These properties maintained an average market time of 44 days, identical to the duration recorded in the prior year.
Sales Volume Totals:
Total sold volume for the month reached $188,970,225, a 38.2% reduction from the $305,622,563 reported in January 2025.
Estate Median Pricing:
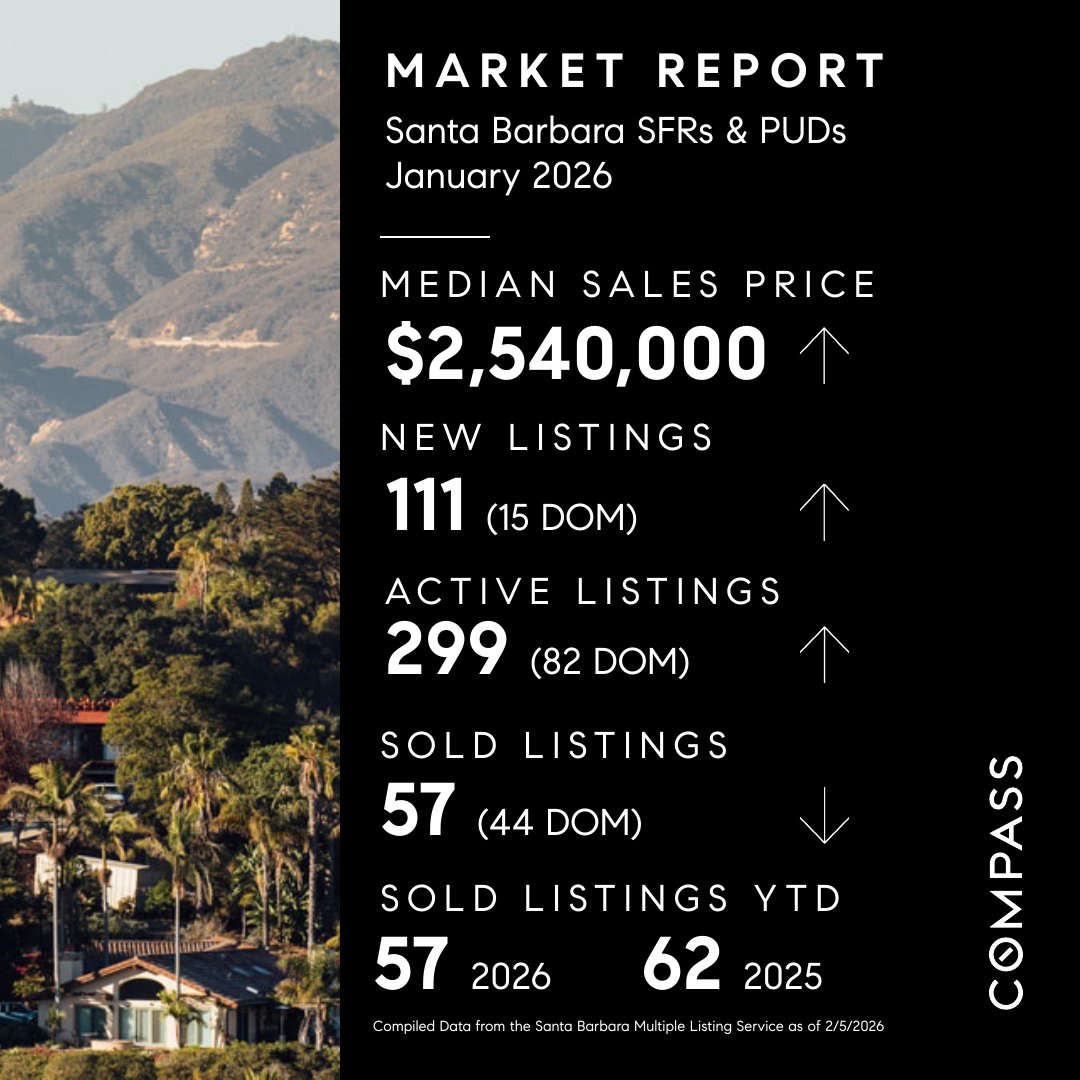
The median sales price for these properties settled at $2,450,000, which is 17% lower than the previous year's median of $2,950,000.
Active Inventory Growth:
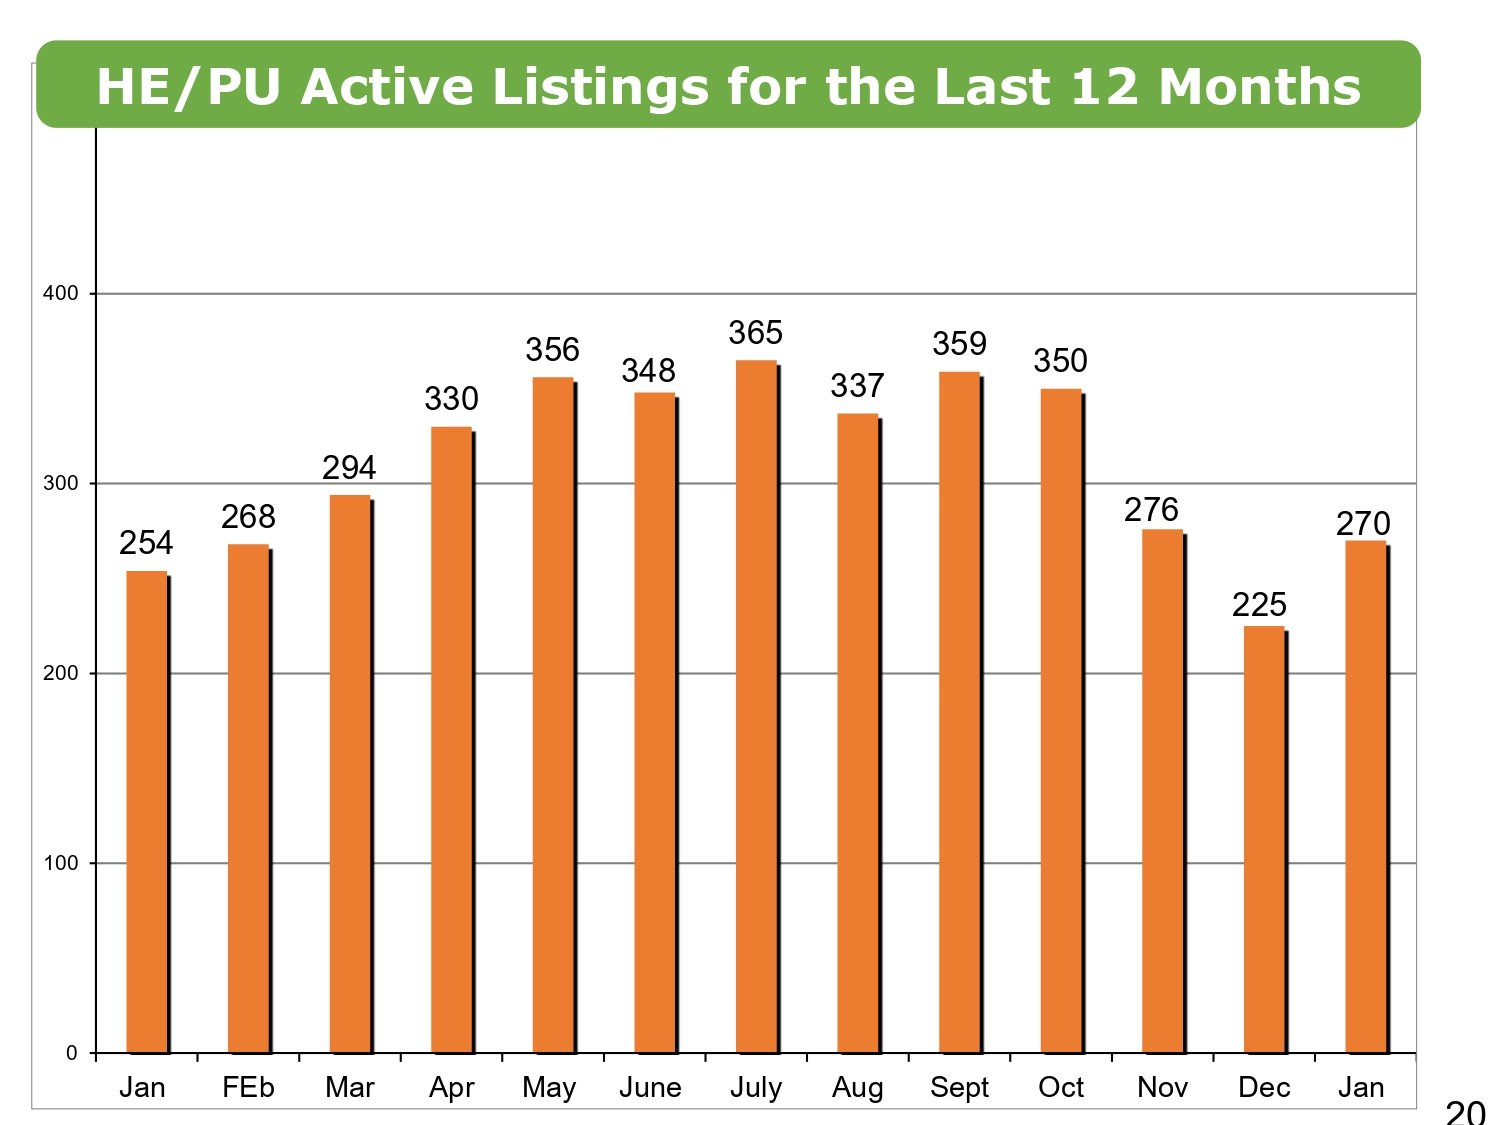
Total active inventory rose to 270 units, marking a 6.3% increase over the 254 units available at the same time last year.
New Listing Performance:
The market saw 111 new listings enter the sector, reflecting a 16.5% decrease compared to the 133 listings added in January 2025.
Listing Value Trends:
The median list price for these properties adjusted downward by 18.7% to $2,540,000 from the $3,124,500 recorded in the prior period.
The decline in both median and average sales prices occurred alongside a stable number of properties entering escrow, which held firm at 76 units for both January 2025 and 2026. This consistency suggests that buyer demand persists even as price points recalibrate within the South County region.
Understanding the Current Condominium Climate
The condominium market experienced a 9.1% increase in sales volume by unit, with 24 properties sold in January 2026 compared to 22 units in January 2025. On average, these units remained active on the market for 53 days before being sold.
Sales Volume Totals:
Total sold volume for the condo sector reached $26,722,200, representing a 27.5% decline from the previous year's $36,834,380.
Condo Median Pricing:
The median sales price for a condominium was $903,750, reflecting an 8% decrease from the $982,500 recorded in January 2025.
Inventory Contraction:
Active listings in this segment decreased by 6.3%, leaving 75 units on the market compared to 80 in the prior year.
New Listing Volume:
New inventory fell by 22.7% as only 34 new condo listings were added to the market in January 2026.
Escrow Activity:
The number of properties that moved into a pending state saw a slight reduction of 3.6%, totaling 27 units for the month.
The condominium segment showed a significant 33.5% drop in the average sold price, falling to $1,113,425. This shift, combined with a reduction in new listings, points to a market where available options are becoming more concentrated in lower price brackets.
Strategic Moves for Local Buyers and Sellers
Sellers in the current market must recognize that median prices have adjusted downward from the levels seen at the start of 2025. Professional valuation is critical to navigate the single-family sector, where a 6.3% increase in active listings provides buyers with more leverage than in the previous year.
Buyers may find favorable conditions in the single-family sector due to the notable 17% decrease in median sales prices. However, the condominium market remains constrained by a 22.7% drop in new listings, suggesting that buyers in this segment should be prepared for limited inventory throughout the early part of the year.
A New Chapter for the Santa Barbara Market
The data from January 2026 indicates a clear moderation in the Santa Barbara South County real estate landscape to start the year. While price points and total volumes have eased compared to 2025, the stability in escrow activity across the region highlights a market that is finding a new equilibrium.
Santa Barbara South County Home Estates, and PUD Active Listings for the Last 12 Months
Santa Barbara South County Number of Homes, Estates, and PUDs Sales Year-to-Date 2009 to 2026
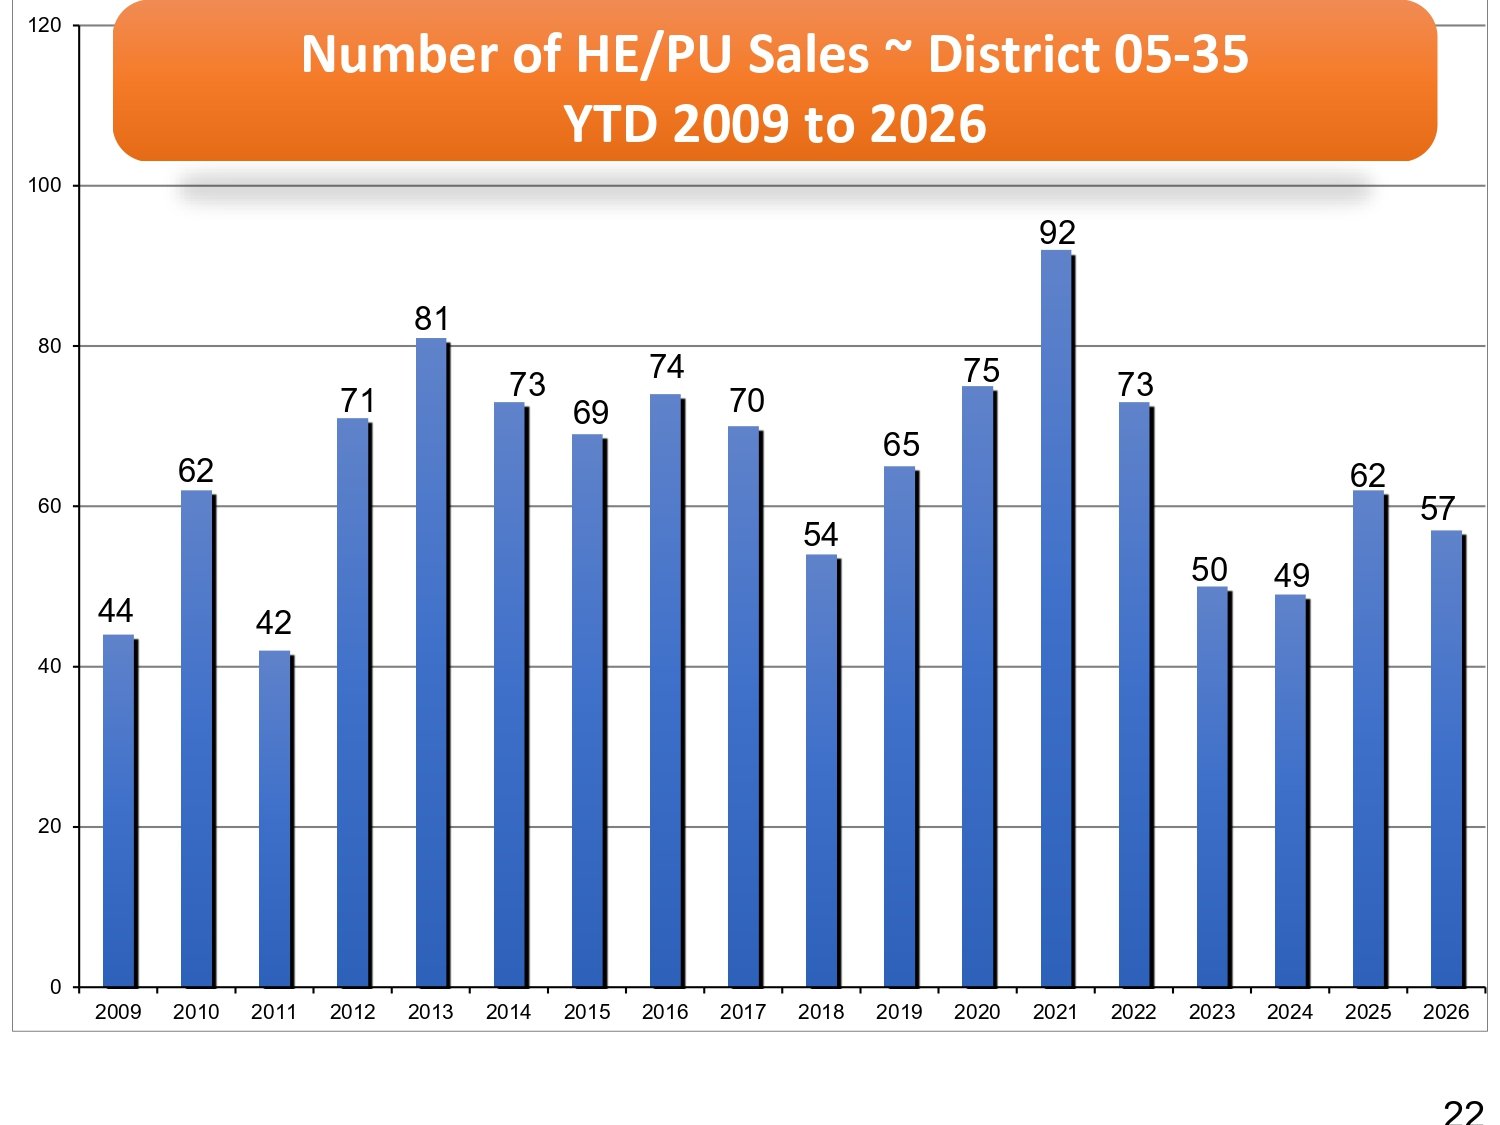
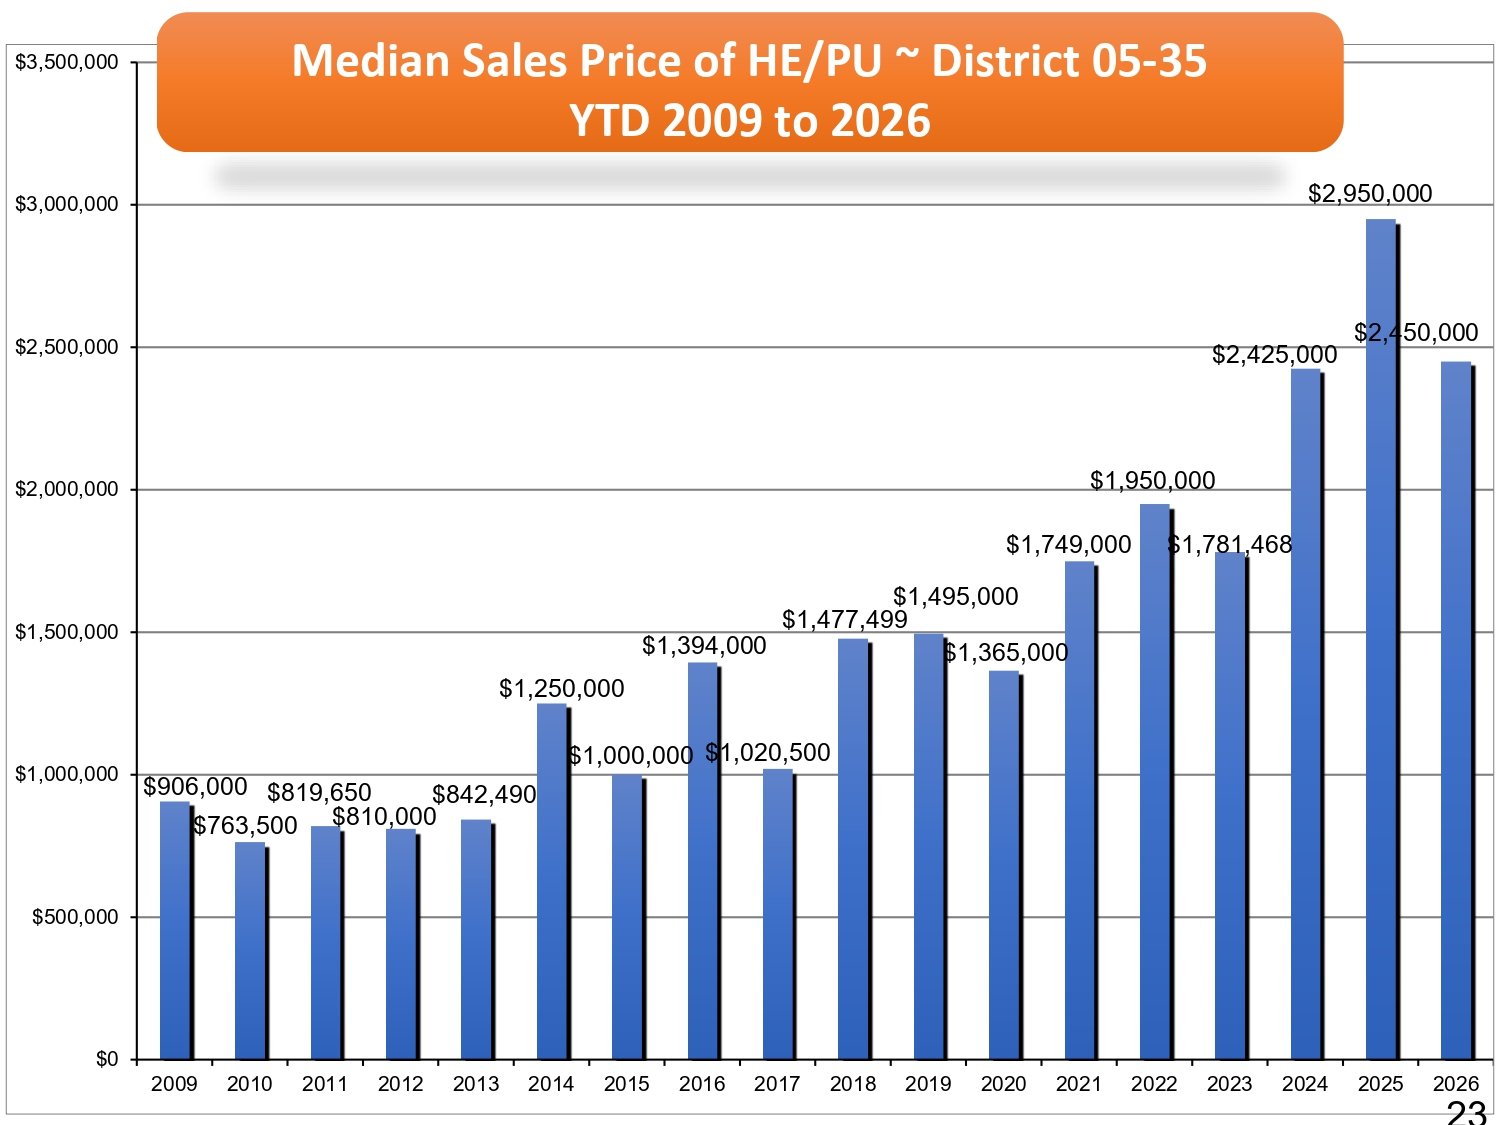
Santa Barbara South County Homes, Estates, and PUD Sales - Year-to-Date 2009 to 2026
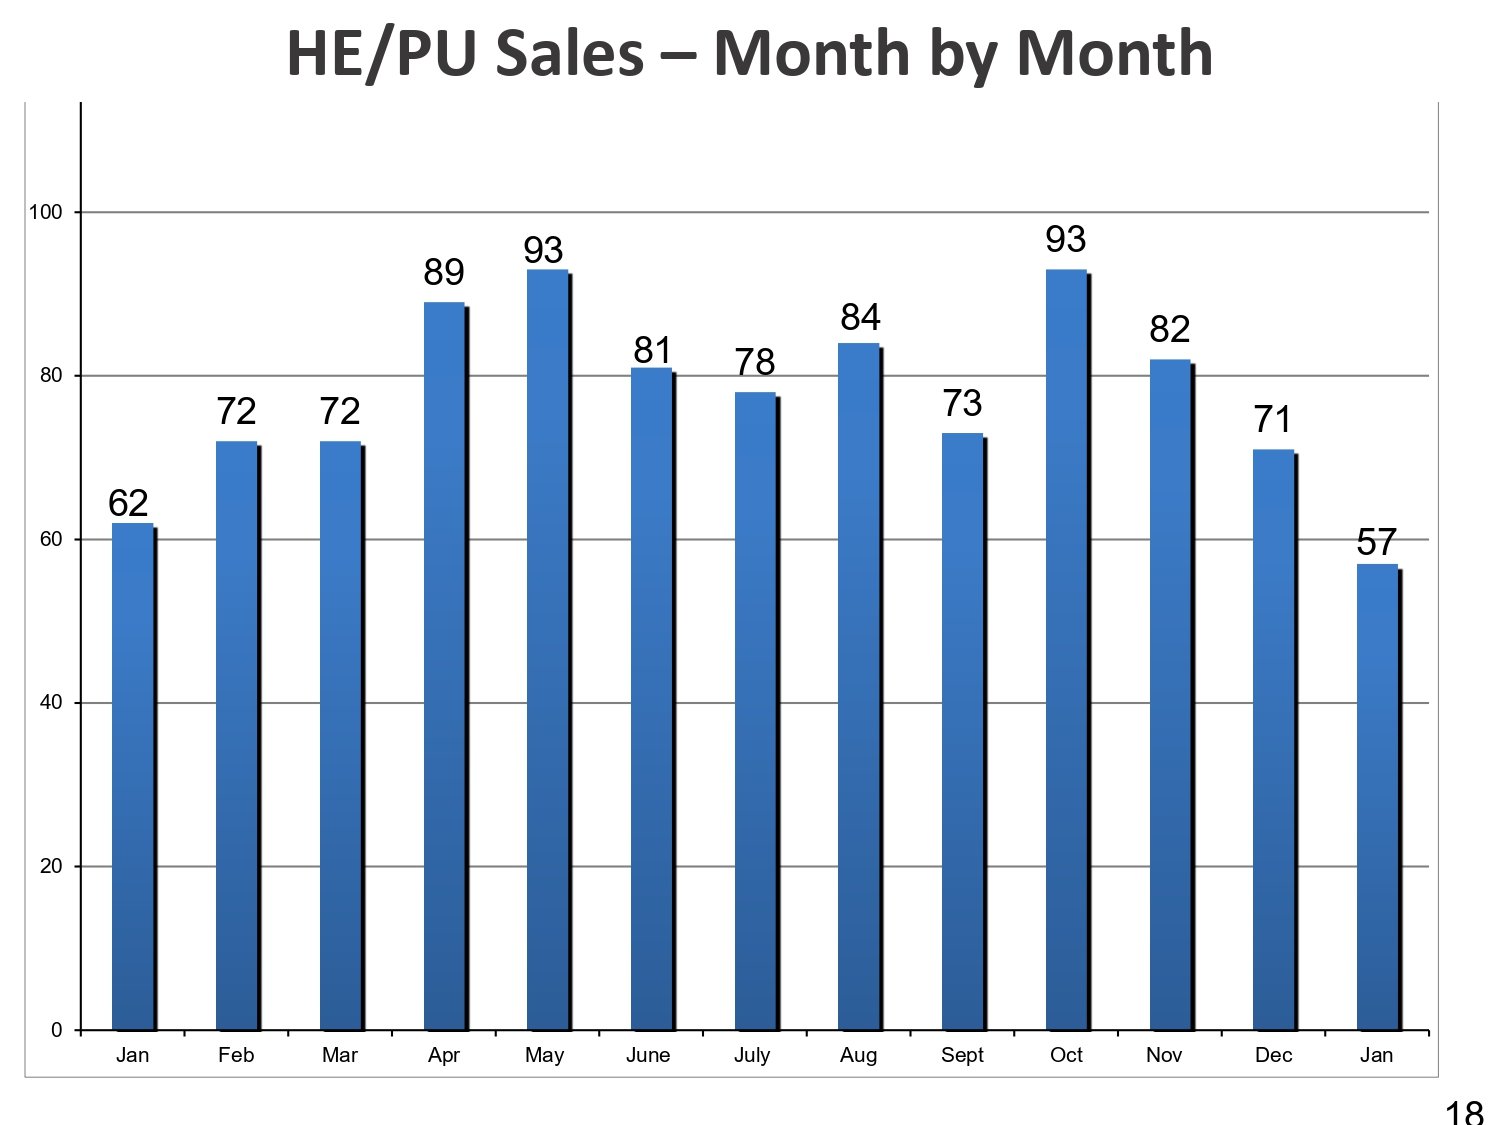
Santa Barbara South County Homes, Estates, and PUD Sales - Month by Month
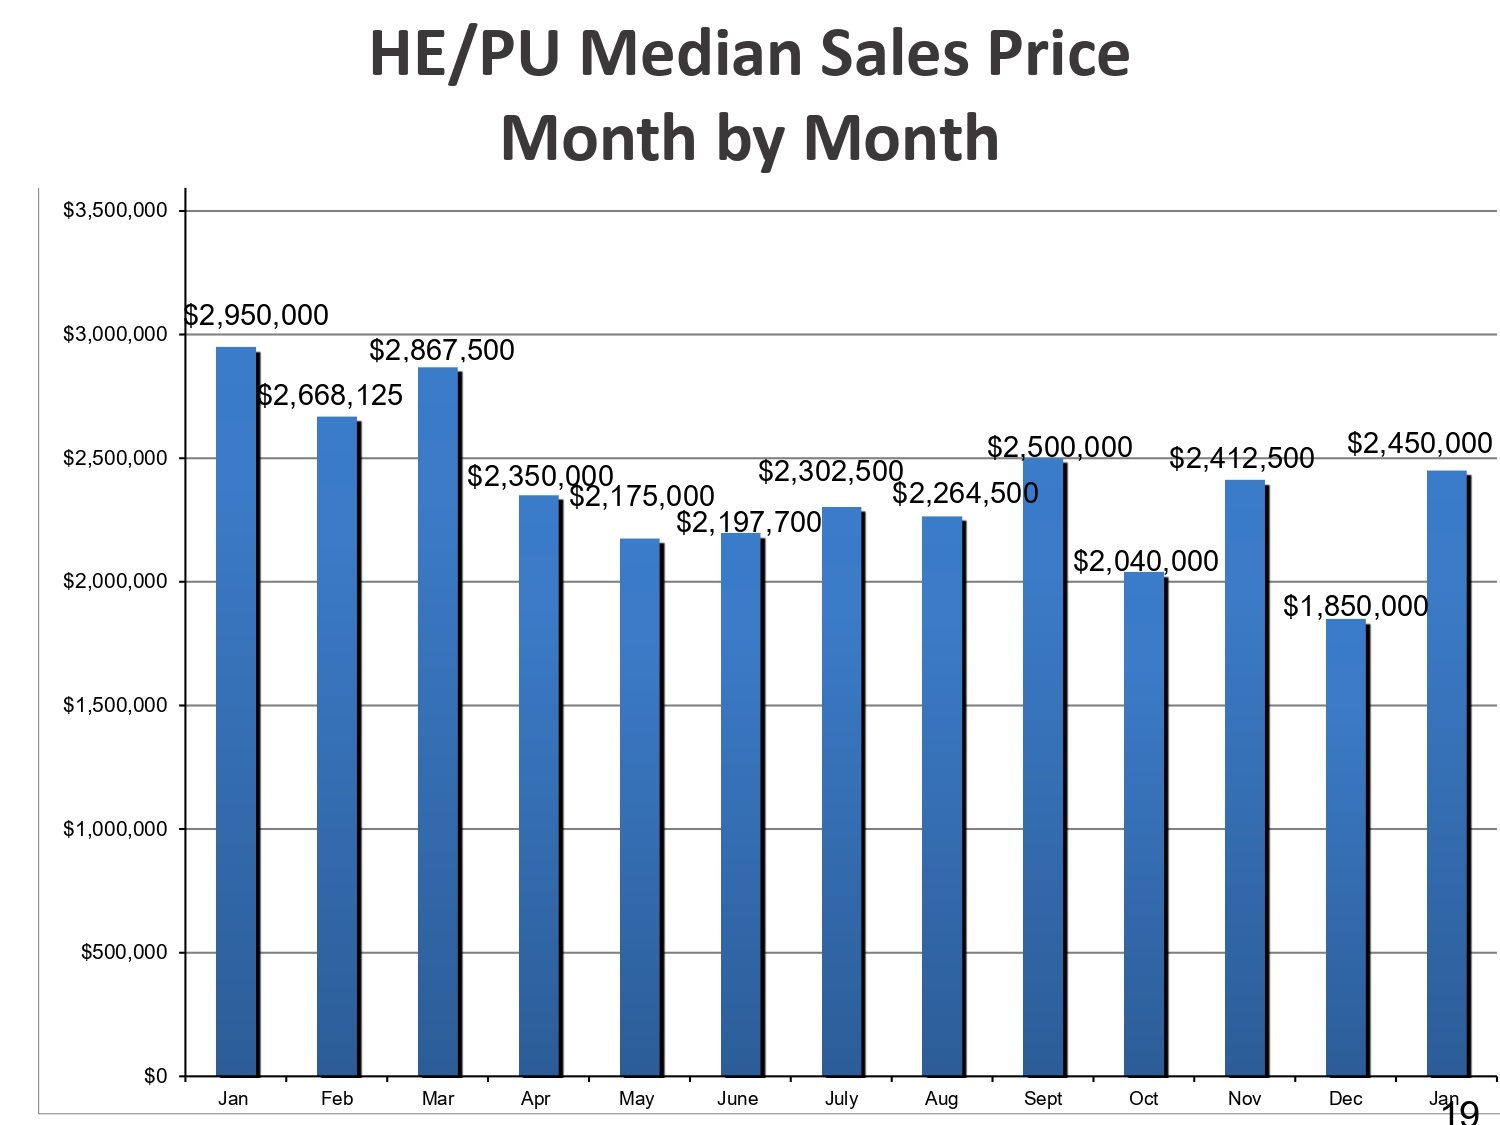
Santa Barbara South County Home, Estates, and PUD Median Sales Price - Month by Month
Professional Guidance in a Shifting Market this 2026
Navigating a shifting market requires the kind of precision and deep local expertise that only a dedicated team can provide. As median prices and inventory levels recalibrate, The Locale Group offers the data-driven insights necessary to help you make informed decisions in this new landscape.
Contact us today to learn how our specialized knowledge of the Santa Barbara South County market can work for you.
M: (805) 284-3660
E: [email protected]