Santa Barbara South County MLS Statistics For October 2025
Real Estate Market Update

Here are the SB MLS Statistics for October 2025: https://sbaor.org/clientuploads/2025/Stats/October_2025_stats.pdf
In October 2025, the Santa Barbara real estate market remained active across all segments, though some changes indicate a slightly slower pace than in recent months. Sales stayed strong, but buyers and sellers are taking longer to negotiate, and homes are spending more time on the market. Extended Days on Market (DOM) and small shifts in Sale Price to List Price (SP/LP) ratios show that transactions are proceeding more deliberately, reflecting a return to traditional market patterns.
High-end Homes Are Shaping the Single-family Market This Month
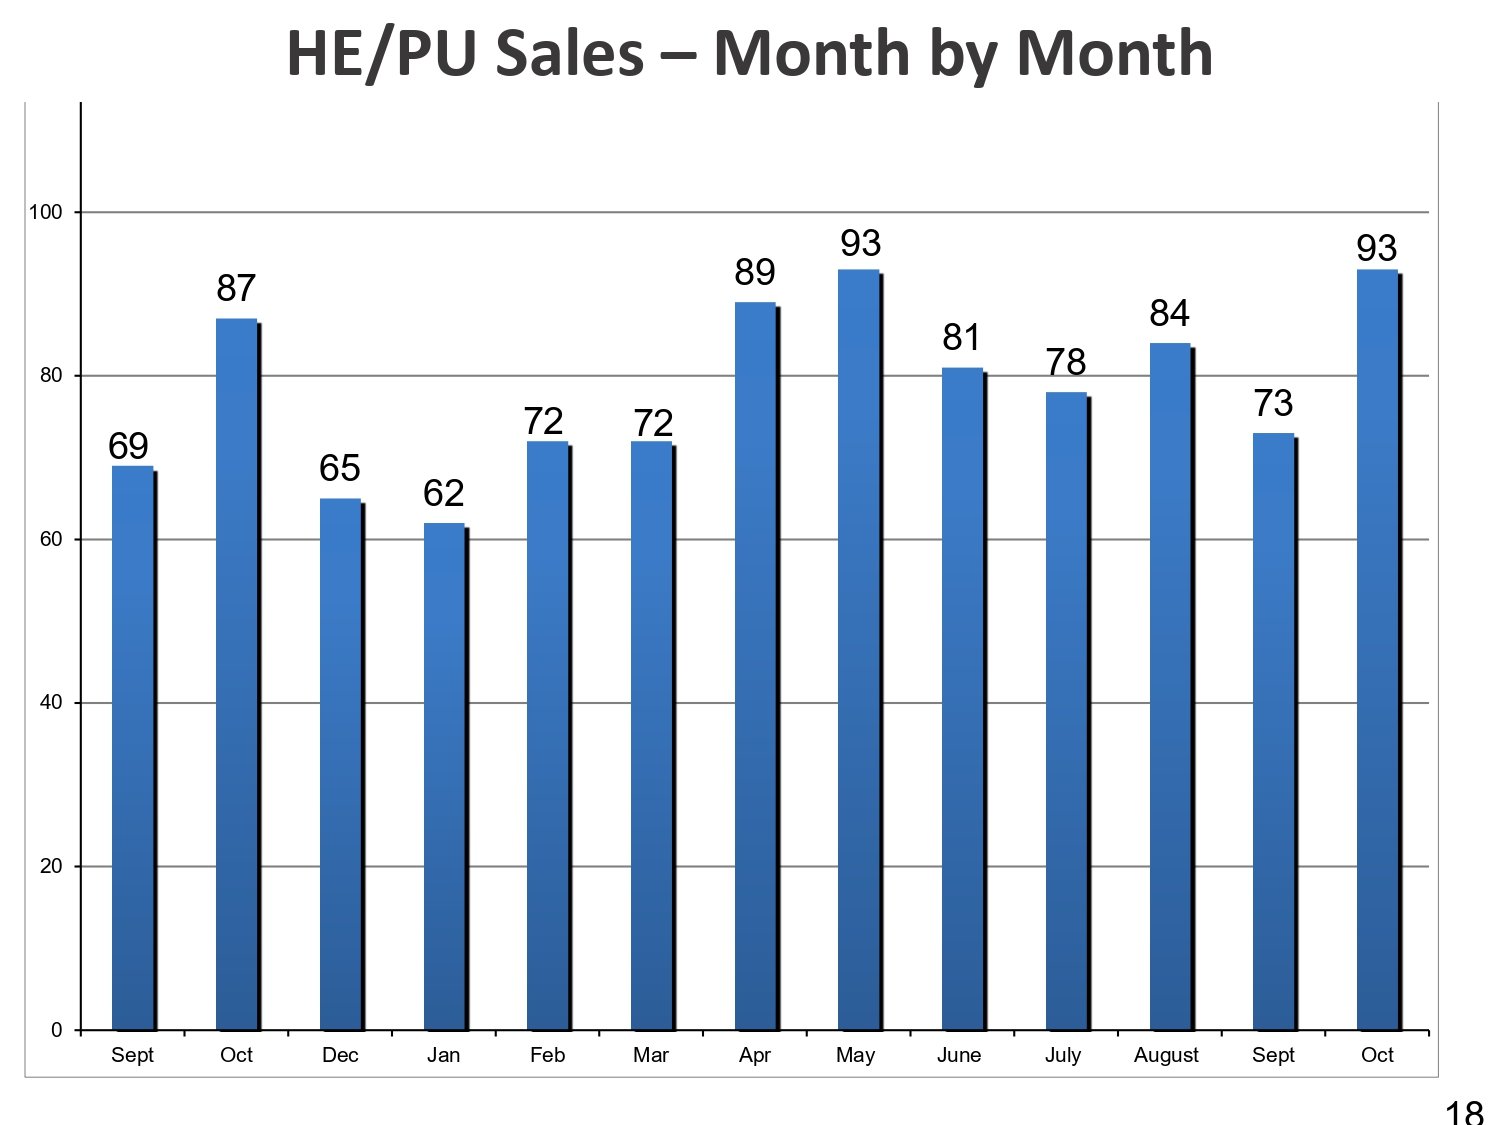
The HE/PU segment maintained solid performance, with 93 units sold in October 2025, up 6.9% from 87 units in October 2024. Total sold volume jumped 57.7% year-over-year to nearly $392.3 million, driven by high-value transactions. The median sold price edged slightly lower to $2,040,000 (-3.8% YOY), while average DOM increased from 33 to 46 days (+39.4%). The SP/LP ratio decreased slightly from 95.53% to 94.55%, showing that buyers achieved modestly greater negotiation leverage.
Luxury sales had a strong impact on total volume. The average sold price in October was $4,218,345—more than double the median—and the highest sale reached $60 million. Properties listed above $5 million accounted for 14 sales, with an average DOM of 117 days and a Cumulative DOM (CDOM) of 216 days, highlighting the longer timeline required for high-end transactions.
Year-to-Date HE/PU Performance (Through October 2025)
- Total Sold Properties: 803, up 25.1% from 642 in 2024
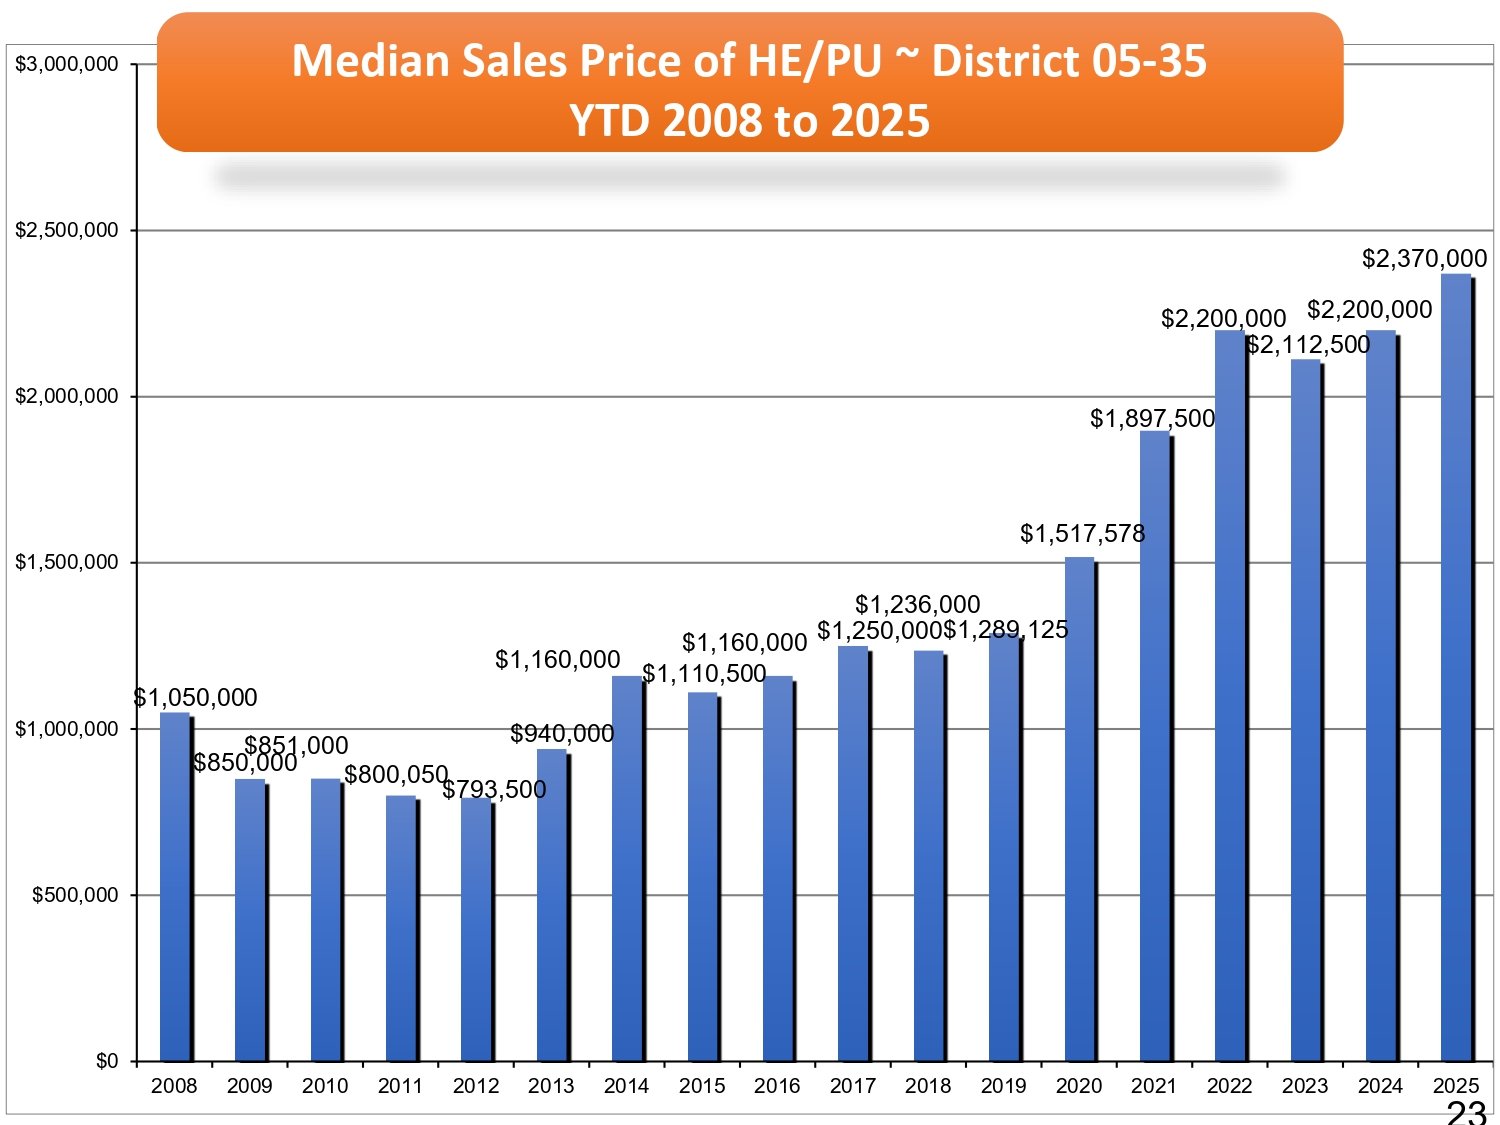
- Median Sales Price: $2,370,000, up 12.2% from $2,112,500
- Total Sold Volume: ~$2.94B, up 39.6% from $2.10B
- Active Listings: 1,091, up 15.1% from 948
These YTD figures confirm continued demand and overall market strength. The slight dip in the monthly median price is mainly due to the mix of transactions rather than falling property values.
The Condo Market Remains Active with Longer Negotiation Timelines
The condominium segment, serving as the primary entry point for many Santa Barbara buyers, showed a marked increase in transactional activity in October 2025. Total sold units rose 30% year-over-year to 26, while total sold volume increased modestly to $35.6 million (+3.8%). Median sold price contracted significantly to $957,500 (-22.1% YOY), driven by a concentration of sales in the lower-priced bands. Average DOM doubled from 26 to 52 days, and SP/LP ratios fell slightly to 97.18%, reflecting increased negotiation flexibility in this rate-sensitive segment.
While the $750,000–$949,999 price band accounted for 6 of the 26 condo sales (roughly 23%), it was the primary driver of transactional activity in the entry-level market. Higher-priced condo activity remained limited, with 5 sales above $1.8 million, several of which required extended market exposure.
Year-to-Date Condo Performance (Through October 2025)
- Total Sold Units: 272, up 12.4% from 242 in 2024
- Median Sales Price: $1,025,000, up 2.8% from $996,625
- Total Sold Volume: $369.3M, up 18.9% from $310.7M
- Active Listings: 351, up 17.4% from 290
This YTD performance highlights that the lower-priced condo segment continues to sustain market activity, while high-end condos remain less frequent and often require longer time on market.
Strategic Observations: What Buyers and Sellers Should Know
October’s data shows a market in steady transition. HE/PU and luxury condo activity continue to support overall volume and value, while entry- and mid-level segments show slower pace and greater buyer leverage. Rising inventory gives buyers more options and time to negotiate, encouraging sellers to price strategically. Overall, the market remains strong, with YTD growth reflecting sustained appreciation and healthy transaction activity.
Santa Barbara South County Home Estates, and PUD Active Listings for the Last 12 Months

Santa Barbara South County Number of Homes, Estates, and PUDs Sales Year-to-Date 2008 to 2025
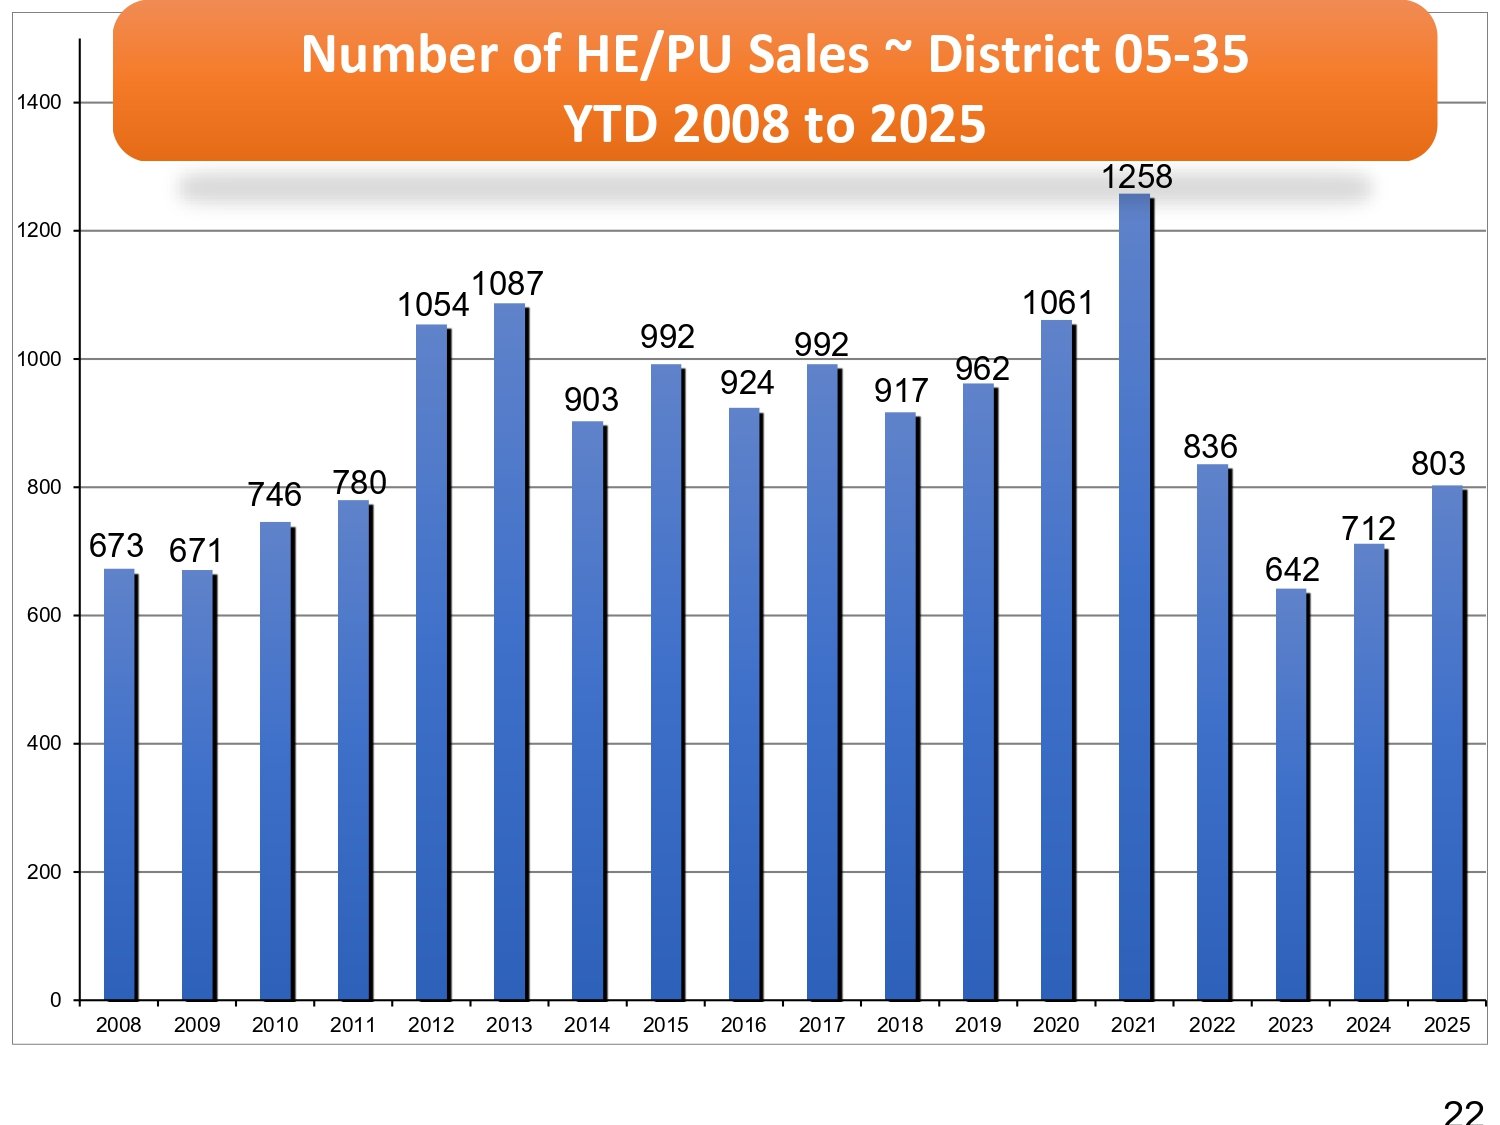
Santa Barbara South County Homes, Estates, and PUD Sales - Year-to-Date 2008 to 2025
Santa Barbara South County Homes, Estates, and PUD Sales - Month by Month
Santa Barbara South County Home, Estates, and PUD Median Sales Price - Month by Month

Making Sense of Today’s Market
Market conditions evolve, and having straightforward analysis makes a difference. At Locale Group | Compass, we translate current data into actionable insight, helping clients stay aware of what’s driving activity.
Request your detailed Santa Barbara Market Report for fresh updates across Santa Barbara, Montecito, and Hope Ranch.
THE LOCALE GROUP | COMPASS
Call or text: (805) 284-3660
Email us: [email protected]