Santa Barbara South County MLS Statistics for May 2026
The Santa Barbara South County housing market established a steadier, more deliberate pace throughout May 2026 as local real estate transitioned into its seasonal summer patterns. Buyers encountered shifting dynamics in available options, while overall sales activity maintained a healthy momentum across both the single-family home and condominium sectors. This comprehensive update analyzes the current balance of inventory, realistic pricing structures, and sales velocity to deliver the exact local data you need for informed decision-making.
Here is the SB MLS Statistics for May 2026: SBAOR Monthly MLS Statistics - May 2026
Buyers Had More Choices, but Competition Didn't Disappear
Inventory pools across Santa Barbara County saw a significant infusion of options, highlighted by 114 newly listed single-family homes and 36 new condominium listings entering the market during May alone. This influx provides purchasing households with expanded possibilities, though high demand keeps well-positioned properties moving steadily into escrow.
Why Single-Family Homes Continued to Draw Attention
Single-family homes and planned unit developments represented the largest share of market activity during the month, drawing steady interest from participants across all price tiers.
Single-Family Home Snapshot:
-
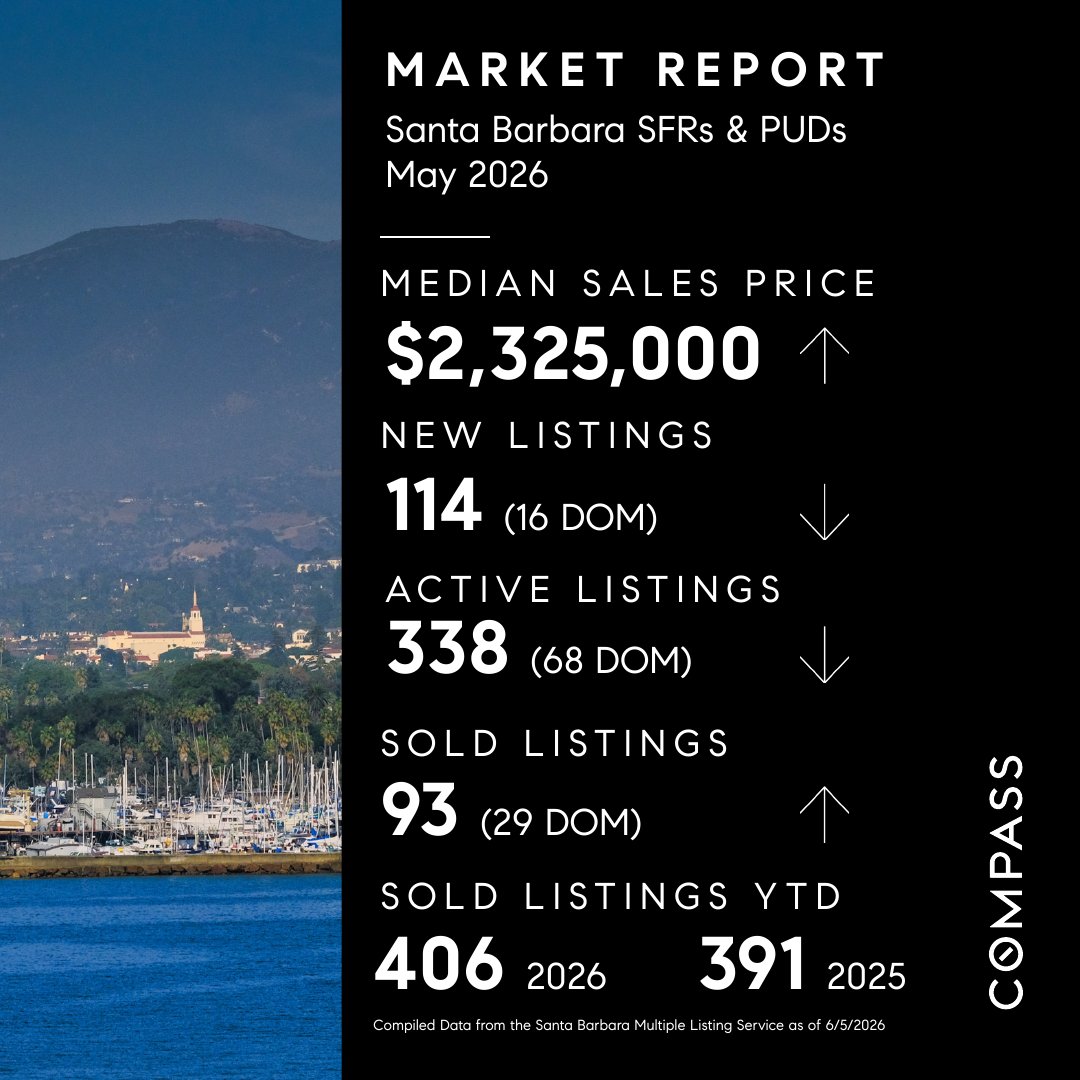
Homes Sold: 93 closed properties
-
Median Sales Price: $2,325,000
-
Average Sales Price: $3,346,625
-
Days on Market: 29 days
-
Sale-to-List Price Ratio: 97.83
The data shows that single-family home sales volumes matched the exact levels of the previous year, highlighting a reliable foundation of local demand where homes regularly command competitive final values.
A Different Story Unfolded in the Condo Market
The attached housing market operated on its own clear trajectory, showcasing strong competition and a high final sale-to-list price percentage.
Condo Market Snapshot:
-
Condos Sold: 35 closed properties
-
Median Sales Price: $960,000
-
Average Sales Price: $1,196,038
-
Active Inventory: 53 currently active units
-
Days on Market: 55 days
Condominiums experienced remarkably tight negotiations during May, with final sale prices compressing close to the original list price at an average ratio of 99.13.
What Pricing Trends Reveal Beneath the Surface
An analysis of pricing dynamics shows that luxury properties continue to elevate average benchmarks, with the highest single-family sale reaching $15,900,000 and the top condo sale hitting $7,737,000. At the same time, accessible options remain present for focused buyers, with the lowest closed single-family home priced at $1,227,000 and the lowest condominium at $184,400.
How Quickly Are Homes Really Moving
Velocity indicators confirm that properties are experiencing healthy market exposure, giving buyers a brief window to deliberate while maintaining general transaction momentum.
Market Pace Indicators:
-
Average Days on Market (DOM): 29 days for single-family homes and 55 days for condominiums
-
Cumulative Days on Market (CDOM): 42 days for single-family homes and 77 days for condominiums
-
Sale-to-List Price Ratio: 97.83% for homes and 99.13% for condominiums
Single-family detached properties generally transitioned to a closed status faster than condominiums, yet both property types achieved strong list-to-sale price preservation upon final agreement.
Strategic Adjustments for Buyers
The fresh wave of inventory entering the market gives your household a valuable window to evaluate properties with true deliberate consideration. Buyers hold a distinct structural advantage today, as properties are closing close to their actual market value, minimizing the pressure to make hasty financial trade-offs. Success relies on studying local neighborhood data, since properly aligned properties continue to capture steady interest from competing households.
Actionable Insights for Sellers
Sellers face a market where 91 single-family homes and 29 condominiums successfully established pending status over the course of May. Success depends entirely on setting a realistic, data-driven price from the start to align with active buyers and stand out against the expanding pool of listings. Additionally, highlighting unique property features and recent upgrades can significantly enhance your home's appeal in a market where buyers have more options to consider.
The Signals Worth Watching This Summer
Looking ahead into the summer season, the local real estate community will monitor the 209 active single-family listings and 53 active condo units to gauge if supply levels expand further. Tracking whether properties moving into escrow continue their upward pace will provide clear signals regarding the long-term sustainability of current pricing.
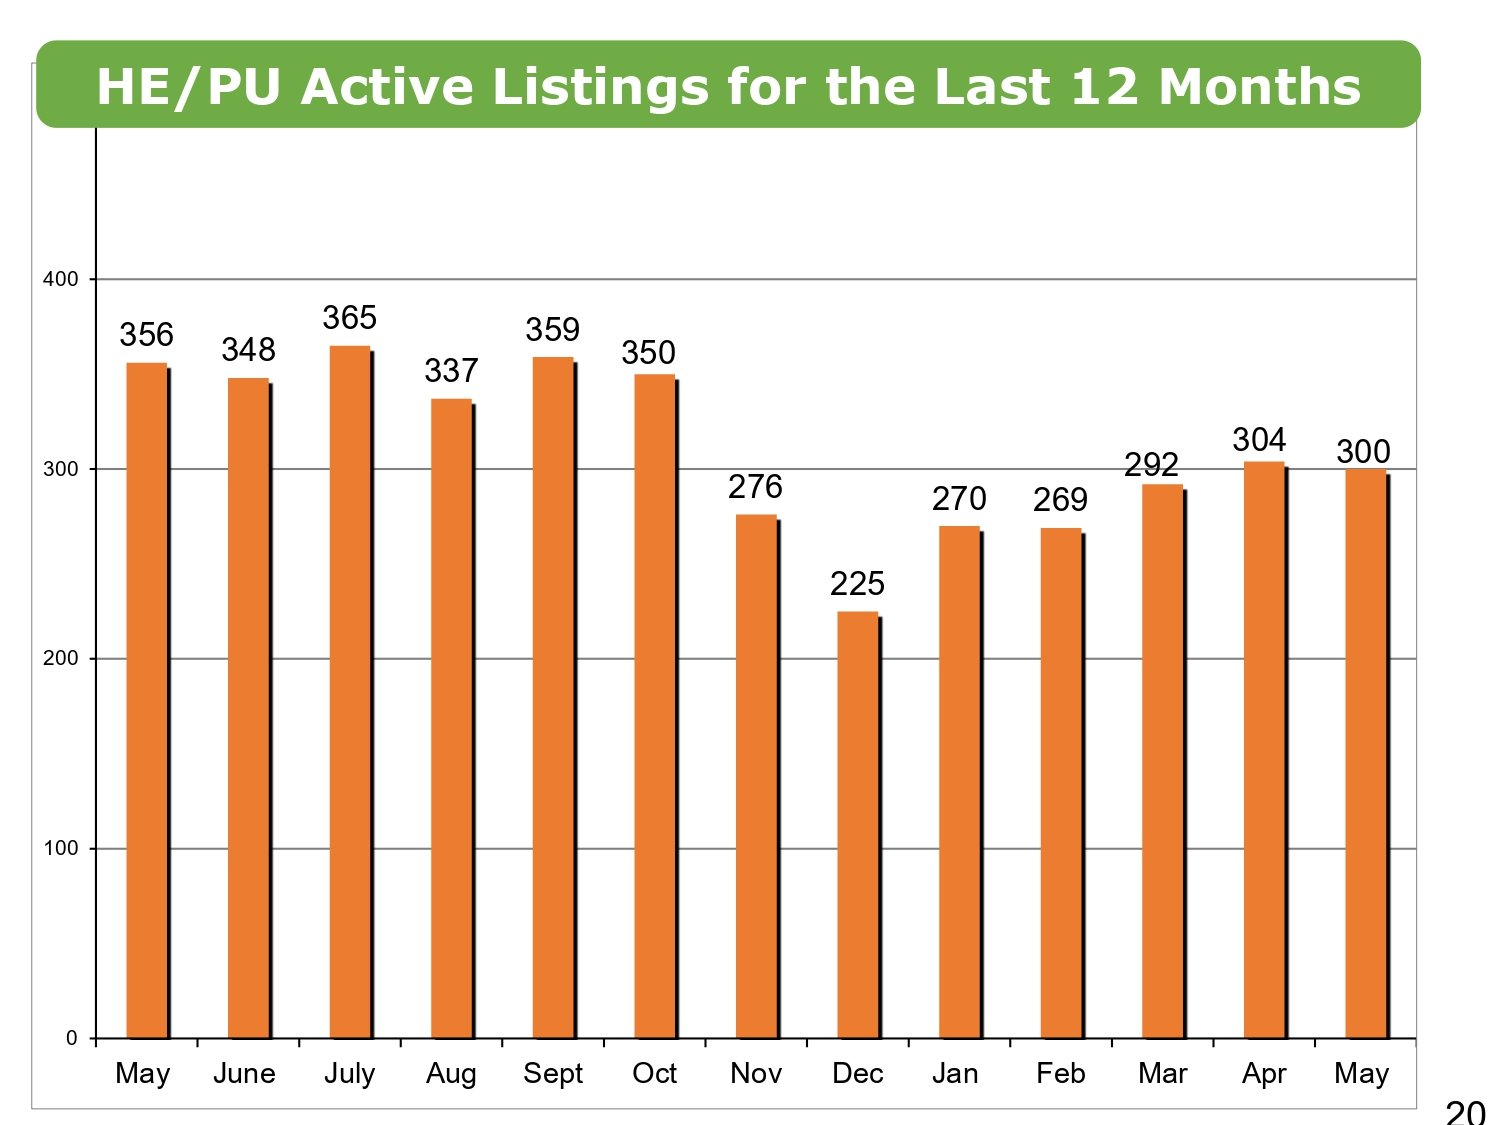
Santa Barbara South County Home Estates, and PUD Active Listings for the Last 12 Months
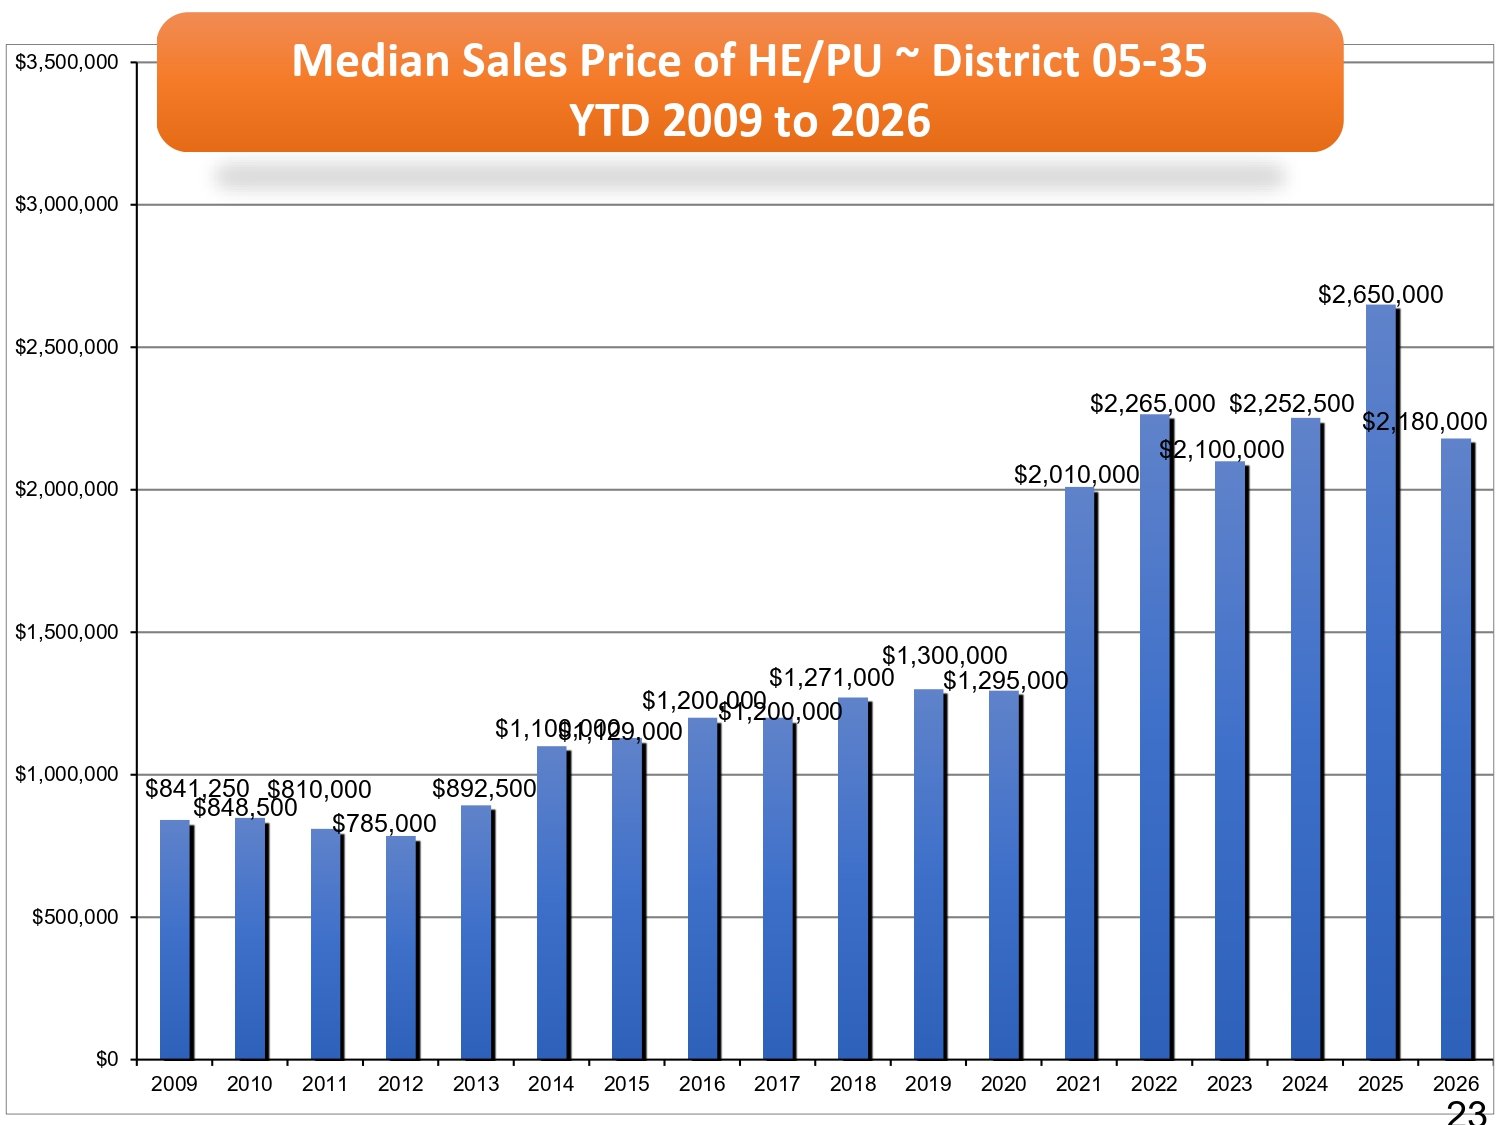
Santa Barbara South County Number of Homes, Estates, and PUDs Sales Year-to-Date 2009 to 2026
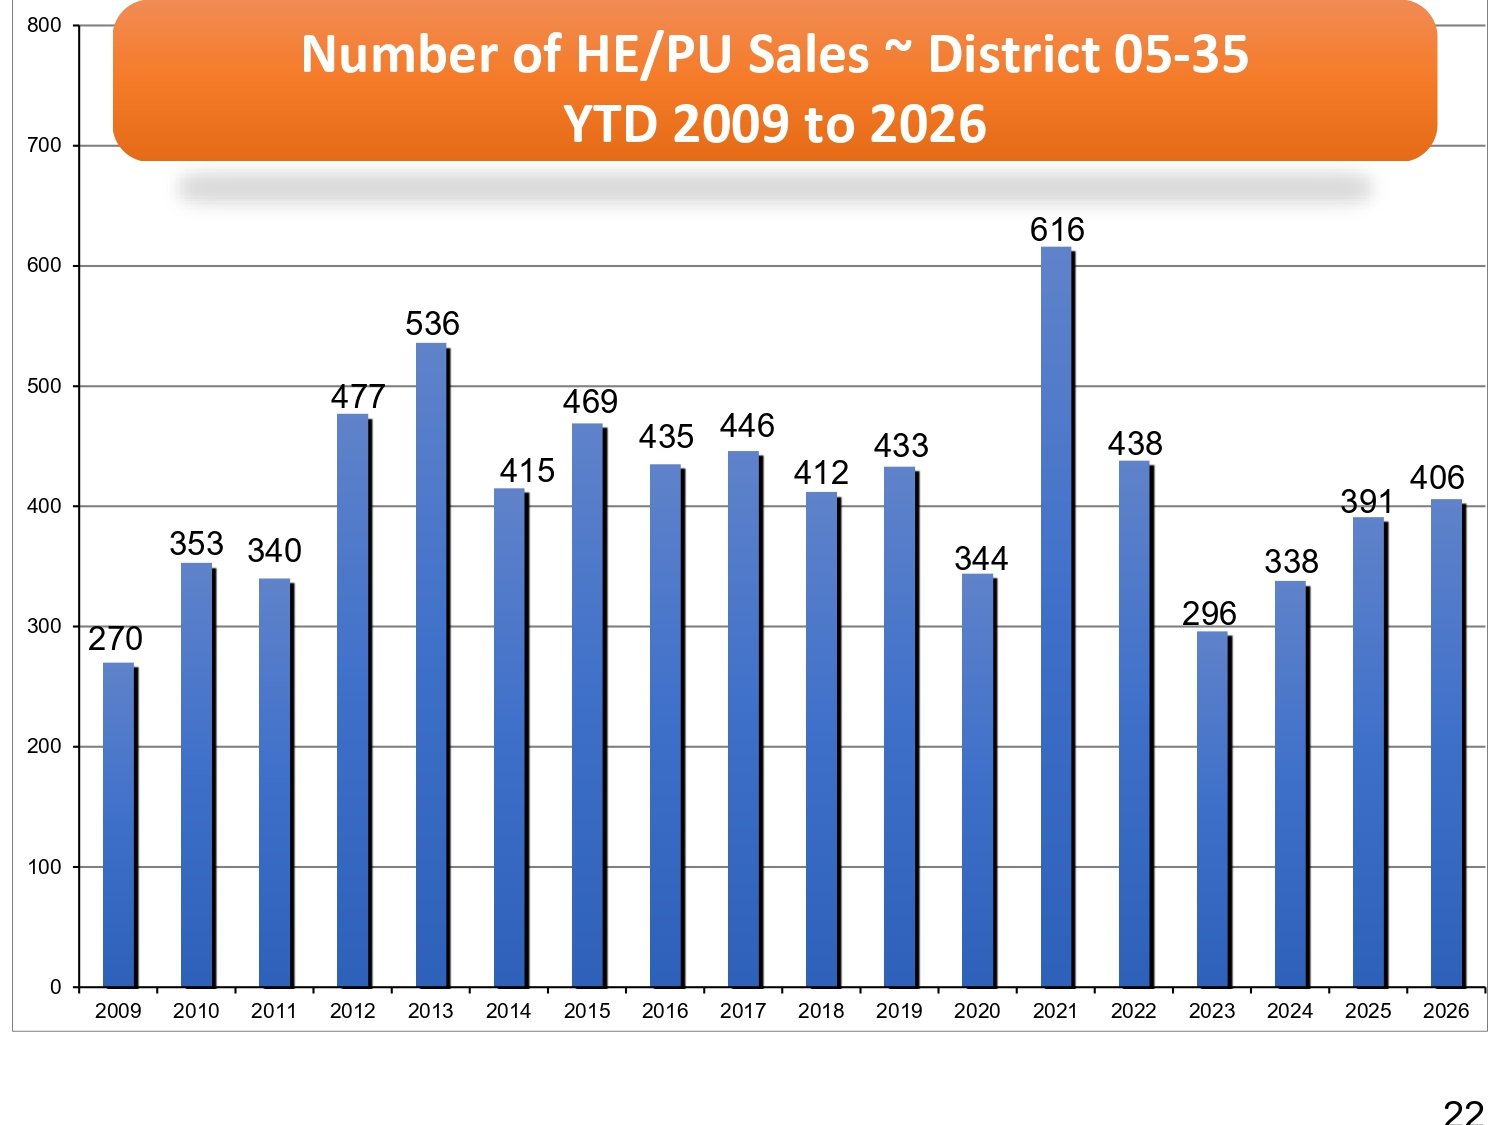
Santa Barbara South County Homes, Estates, and PUD Sales - Year-to-Date 2009 to 2026
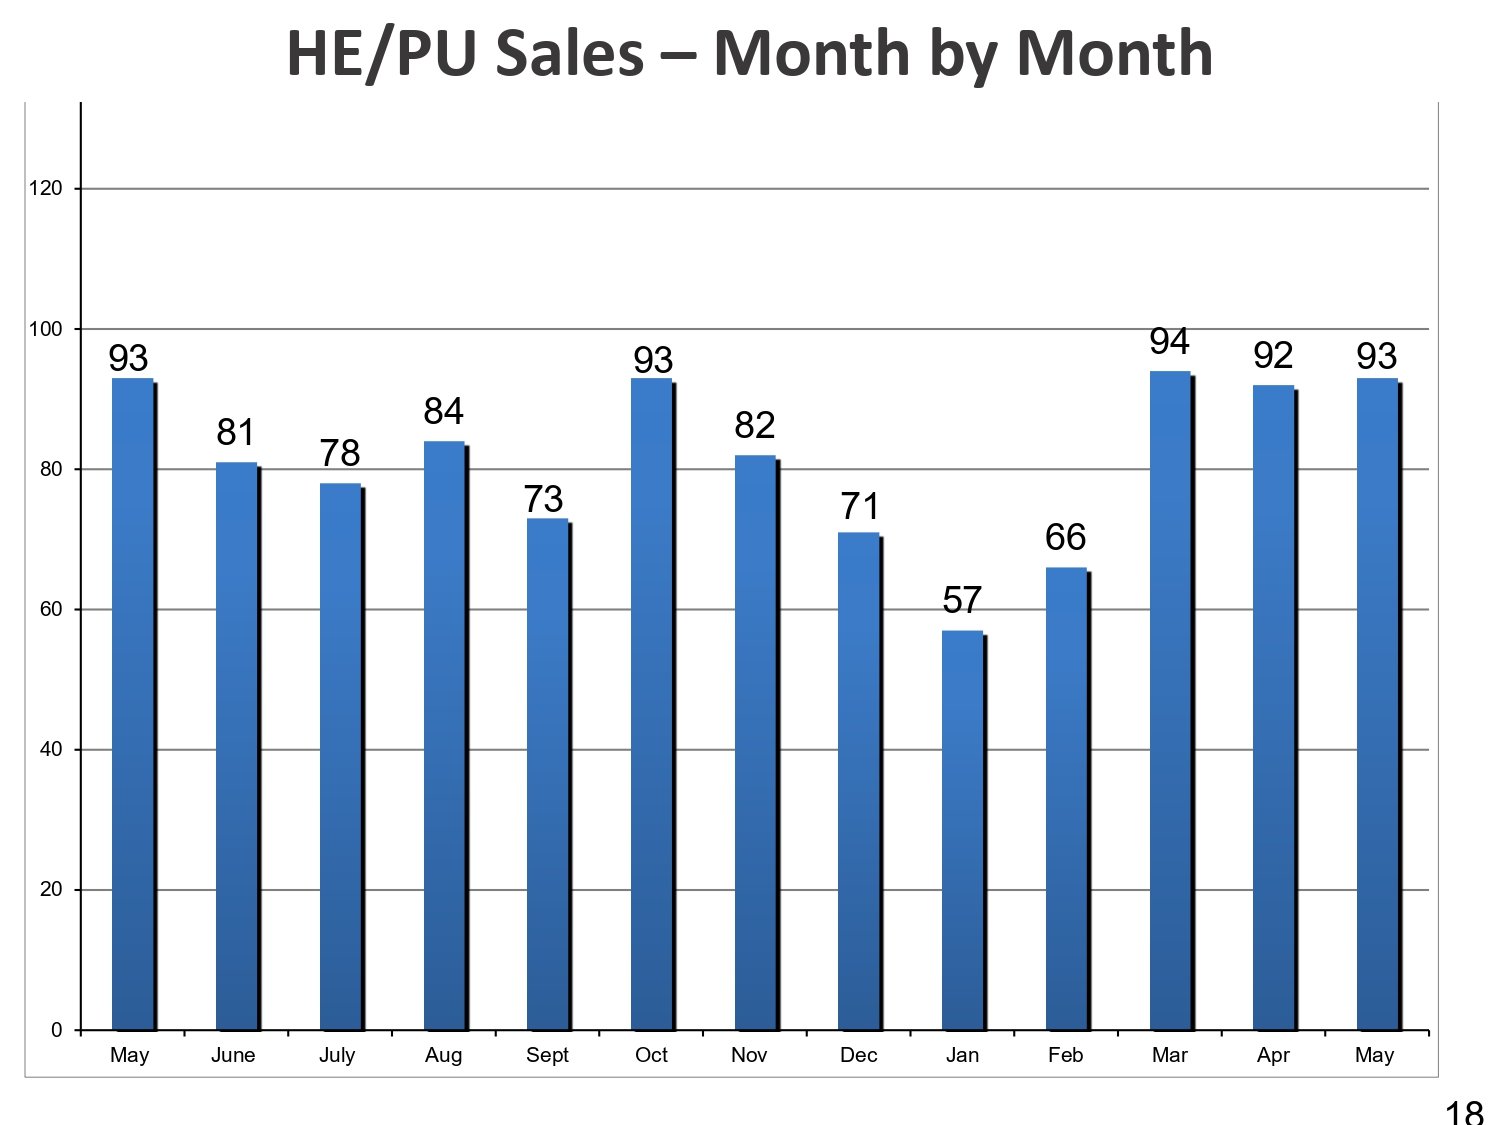
Santa Barbara South County Homes, Estates, and PUD Sales - Month by Month
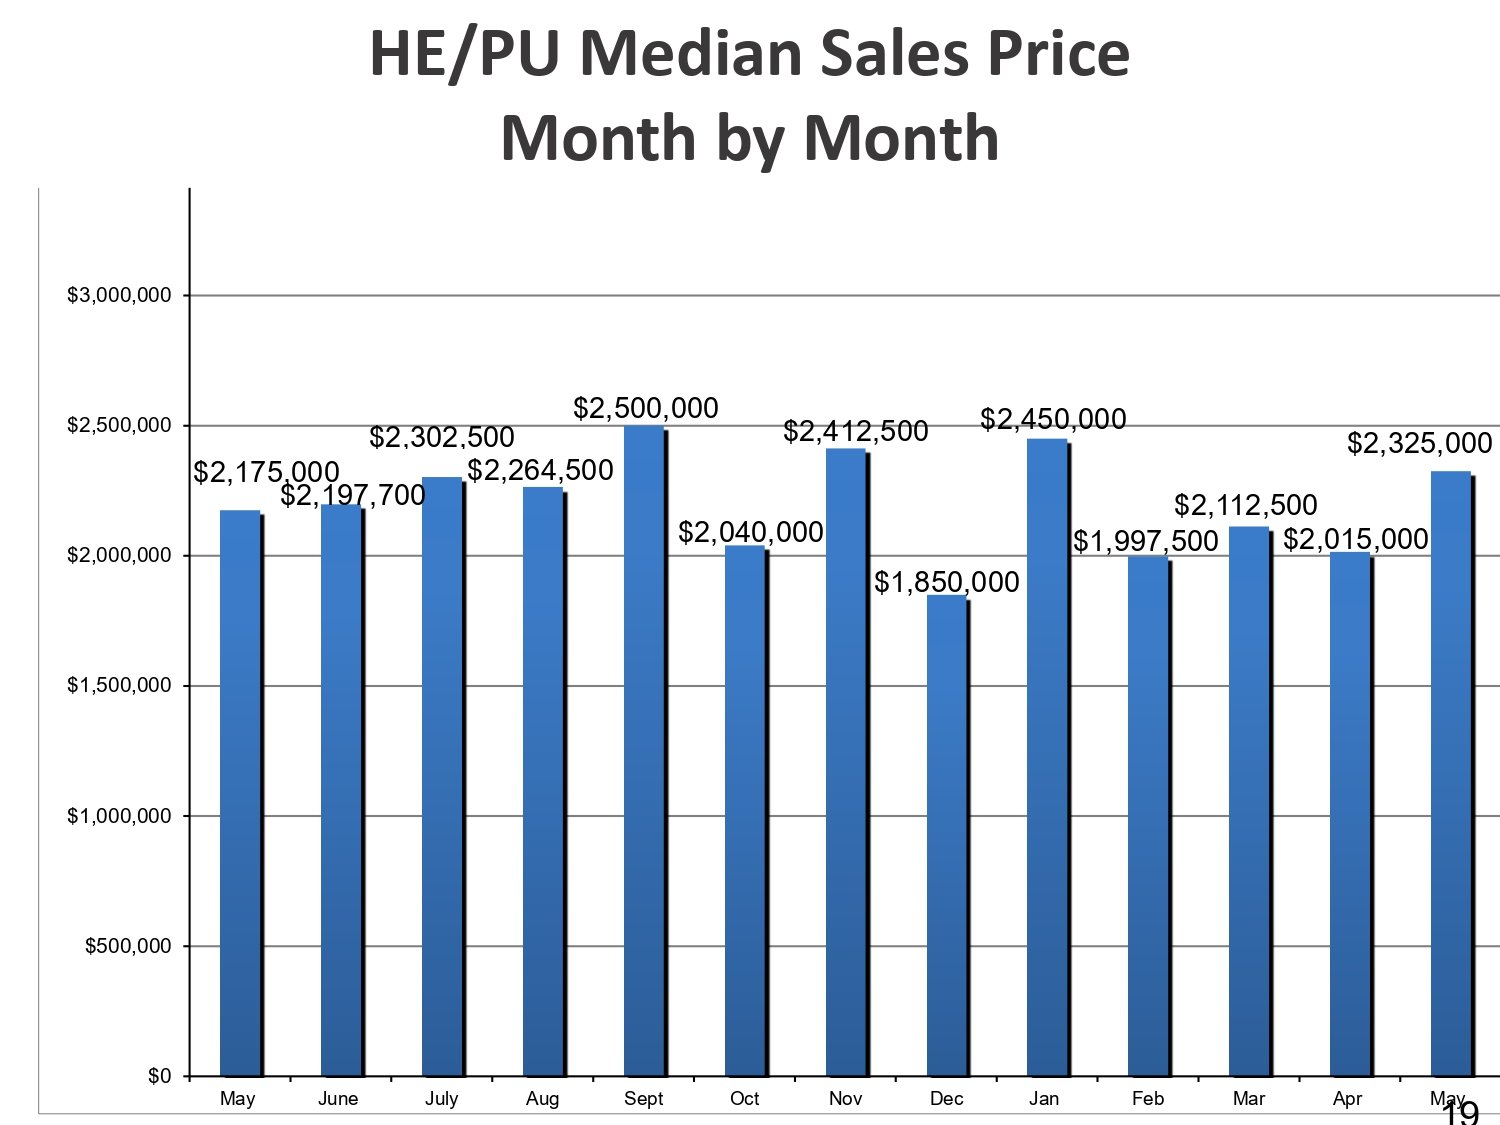
Santa Barbara South County Home, Estates, and PUD Median Sales Price - Month by Month
Your Neighborhood May Be Telling a Different Story
Broad MLS data provides an exceptional birds-eye overview, but actual values shift dramatically between specific coastal and inland micro-markets. Reach out to our professional team today for a hyperlocal, personalized market analysis tailored to your exact neighborhood to ensure your next real estate decision is backed by precise data.
Connect with the Locale Group today!
M: (805) 284-3660
E: [email protected]