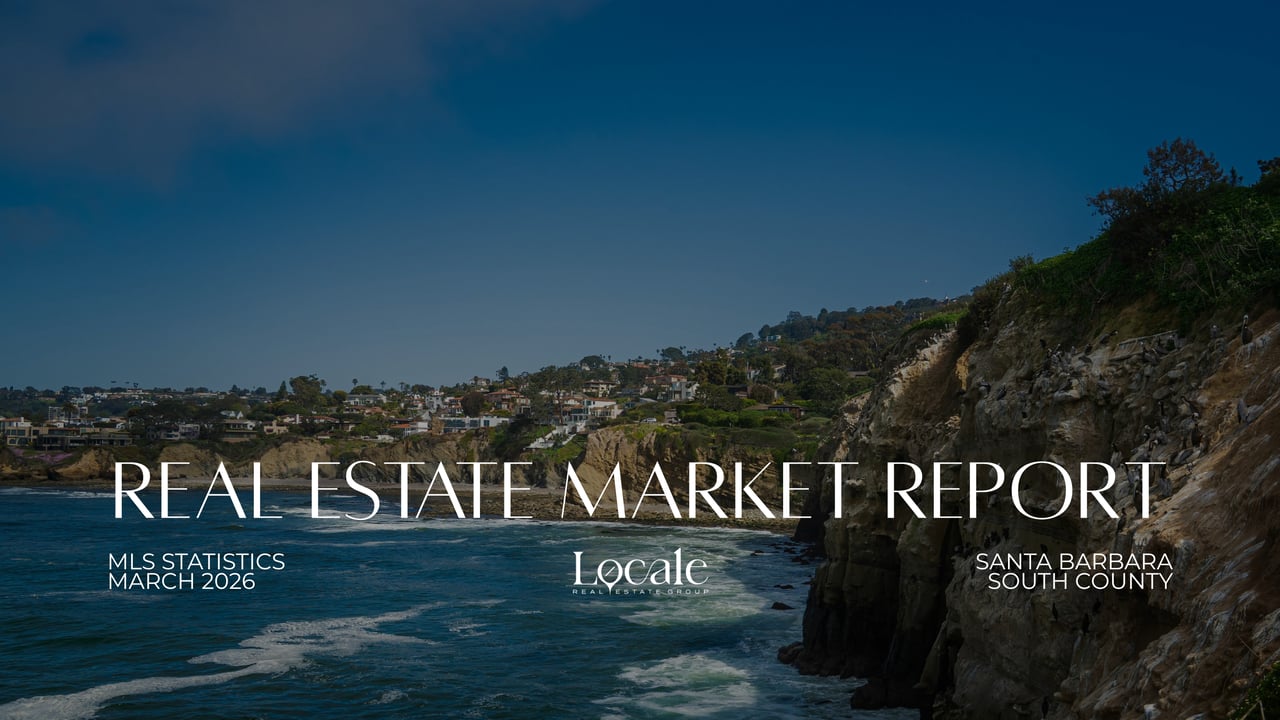
Santa Barbara South County MLS Statistics For March 2026
The Santa Barbara South County real estate market entered the spring 2026 season with a complex profile of increased transaction volume paired with a notable reset in pricing benchmarks. Data from the Santa Barbara Association of REALTORS® highlights a total monthly sold volume exceeding $366 million, signaling a high level of liquidity and activity across the region. While median sales prices for both single-family homes and condominiums have adjusted downward from the previous year’s highs, the 9% rise in properties entering escrow suggests a market that is finding its footing. These figures provide a clear window into a landscape where buyers are re-engaging as inventory levels stabilize.
Here is the SB MLS Statistics for March 2026: SBAOR Monthly MLS Statistics - March 2026
What defined the performance of single-family residential sales in March?
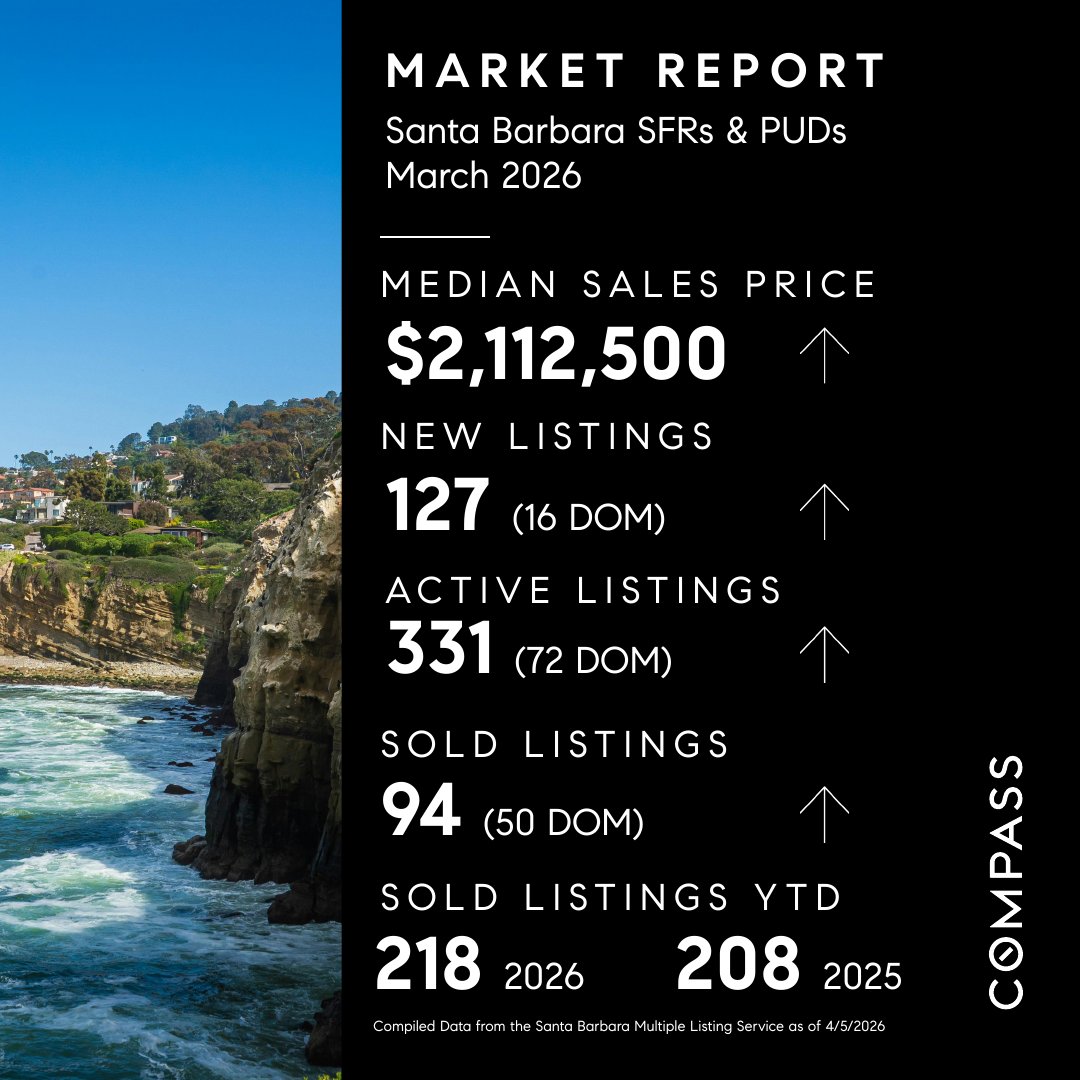
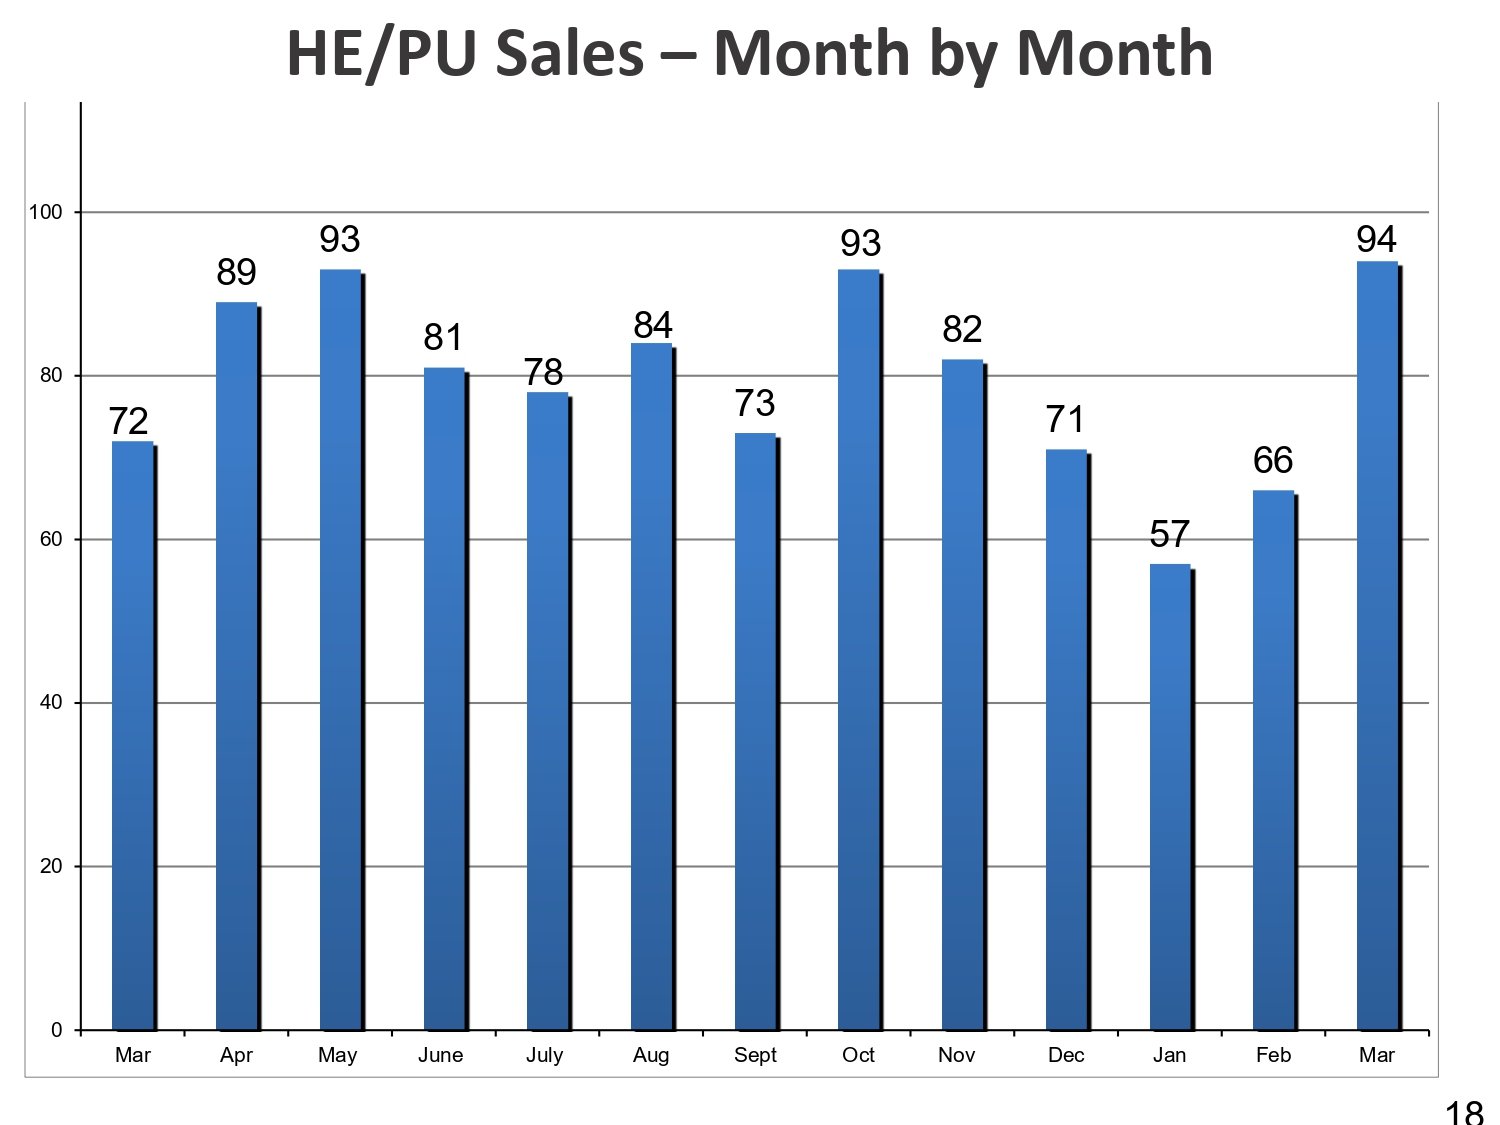
The market for single-family homes and planned unit developments remains the primary anchor of Santa Barbara real estate, with 94 properties successfully closing during the month. Total sold volume for this sector reached $327,436,464, reflecting a consistent flow of capital through the local districts even as pricing structures shift.
-
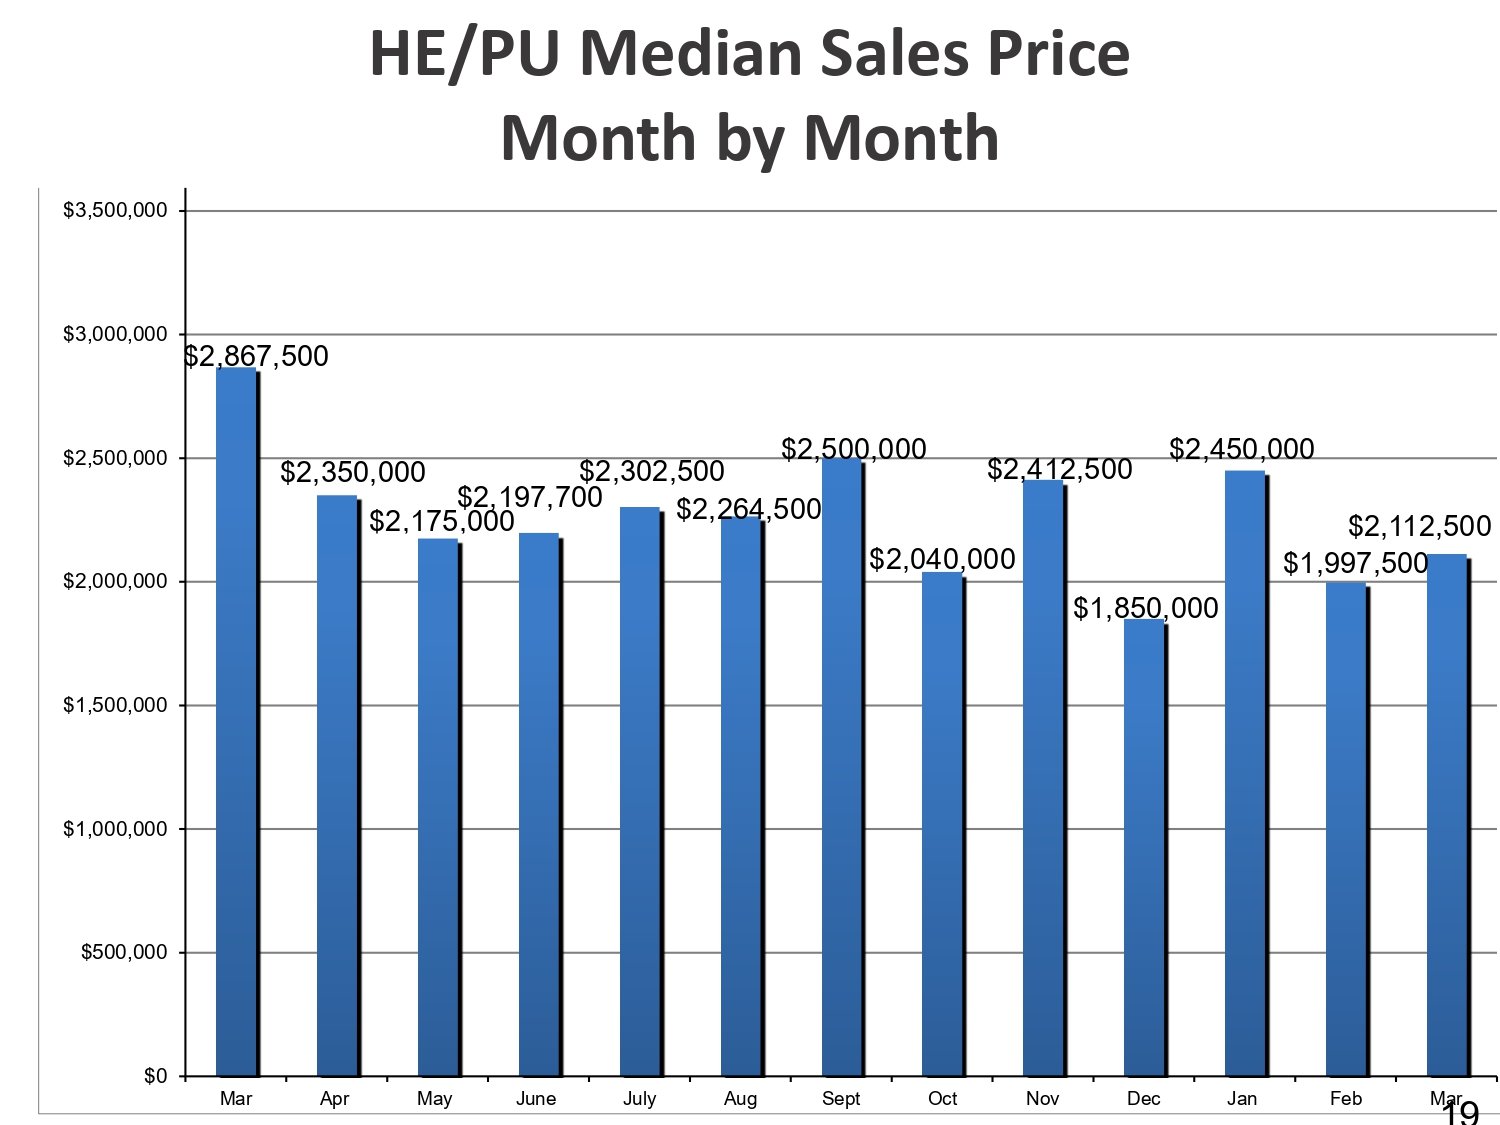
The median sales price for a single-family home settled at $2,112,500.
-
Average sold prices reached $3,483,366, supported by high-end sales across the coastal region.
-
Properties spent an average of 50 days on the market before securing a buyer.
-
The average sale price represented 96.08% of the final list price.
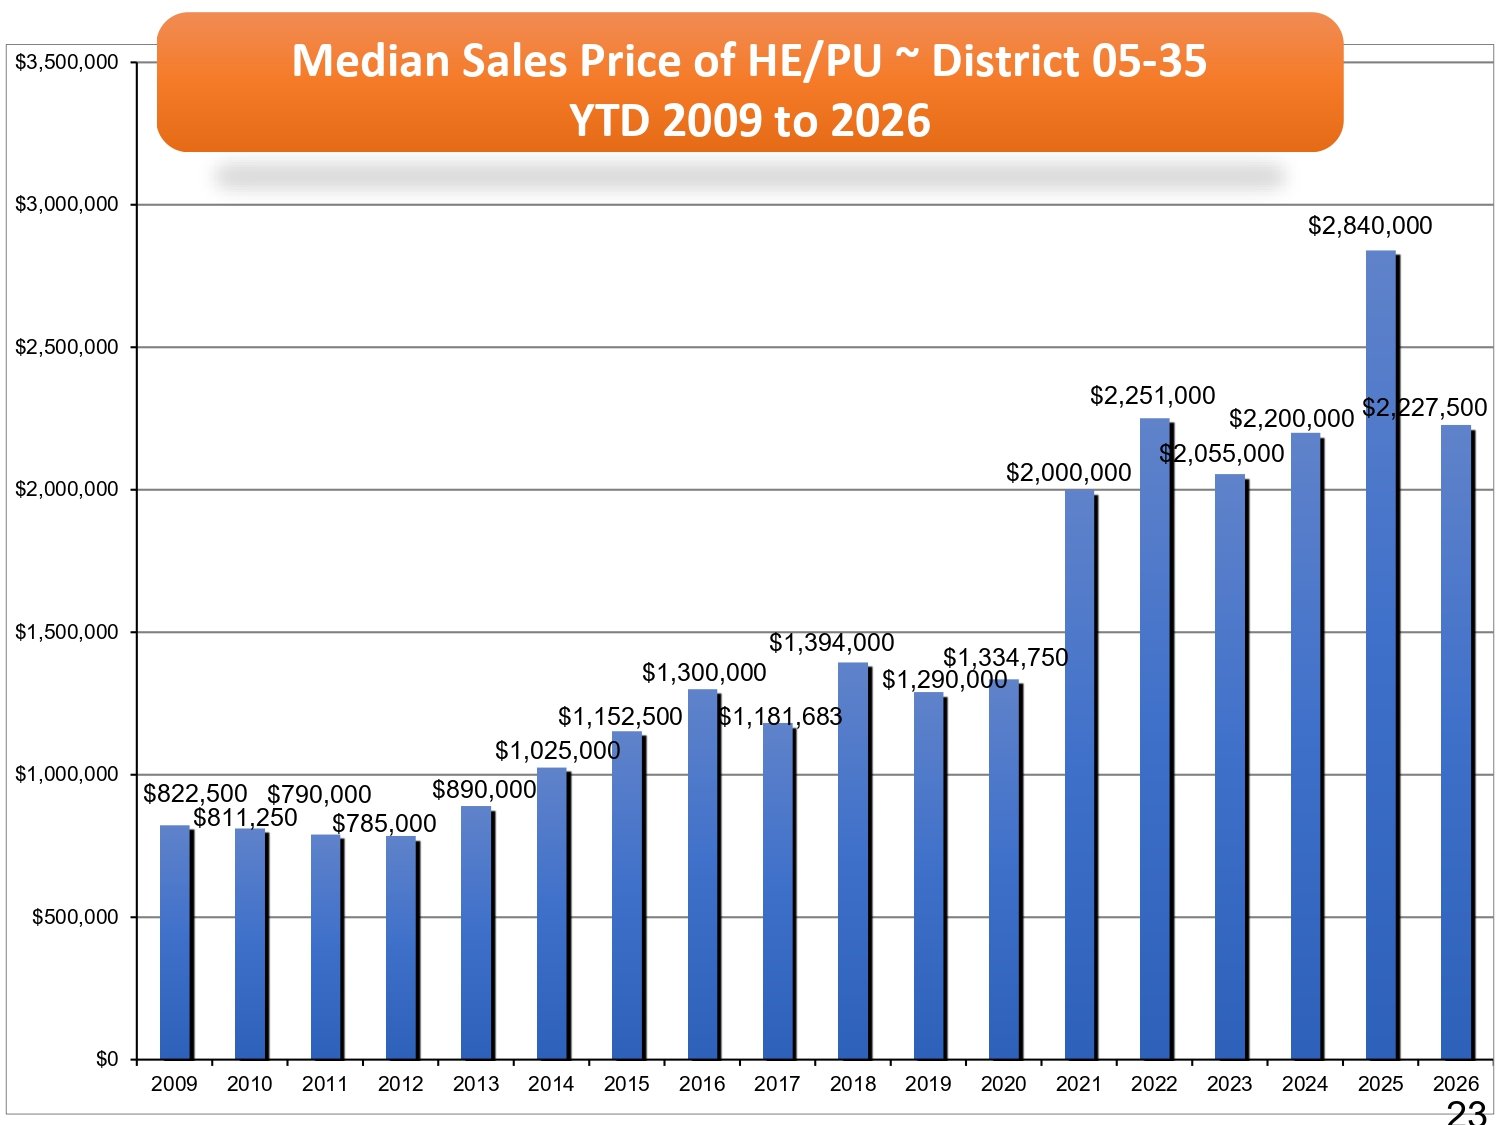
Year-to-date figures through March reveal a broader transition, with the median sales price for single-family homes decreasing by 21.6% compared to the same period in 2025. Despite this correction in price, the actual number of sold properties increased by 4.8%, rising from 208 to 218 units. This indicates that the market is not slowing down in terms of pace; rather, it is recalibrating to a lower price point that is attracting a higher volume of successful transactions.
How did condo inventory and pricing fluctuate in Santa Barbara recently?
Condominiums in Districts 05-35 continue to serve as a vital and fast-moving segment of the housing market, offering essential inventory for a variety of buyers. March saw 28 condo units sold, resulting in a total sales volume of $39,537,415 for the month, with properties moving at a swifter average pace of 43 days.
-
The YTD median sold price for condominiums fell by 6.7% to $1,124,500.
-
New listings increased by 3.5% compared to the previous year, providing a modest boost to supply.
-
Properties entering escrow rose by 4.9%, showing a steady absorption of new units.
-
Total sold volume for the year reflects a 7.3% decrease, primarily driven by lower average sale prices.
The data suggests a highly efficient market where new inventory is being claimed quickly. While the average sold price for condos decreased by 13.9% year to date, the 7.7% increase in the number of units sold demonstrates that demand remains robust when units are priced in alignment with current buyer expectations. The slight 2.9% decrease in overall active listings continues to keep the environment competitive for those seeking entry into the South County market.
Actionable Perspectives for Participants in the South County Property Market
The current statistics reveal a market of opportunity where strategic pricing is the most significant factor for success. Sellers are finding that while the record highs of early 2025 have moderated, the increase in units sold and properties entering escrow proves that buyers are ready to act on well-positioned listings.
For buyers, the downward adjustment in median prices across both sectors provides a more accessible entry point than seen in recent years. Navigating these shifts requires a focus on local district data, as the transition toward more balanced conditions rewards those who stay informed on monthly inventory trends.
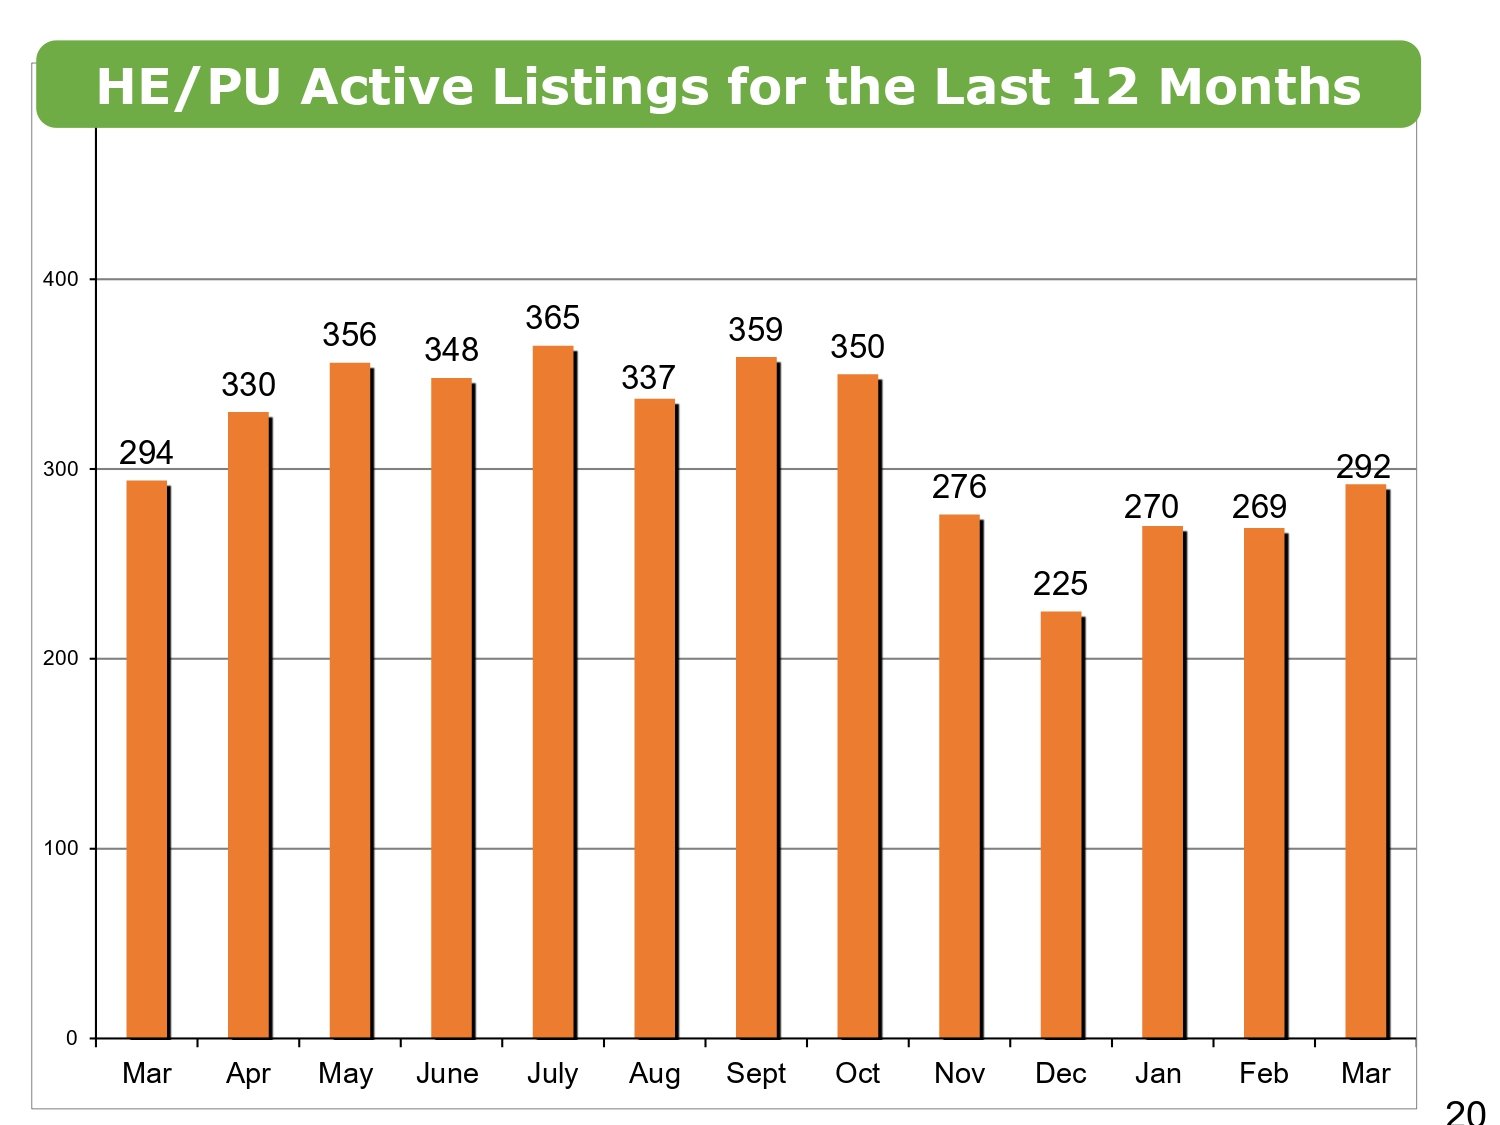
Santa Barbara South County Home Estates, and PUD Active Listings for the Last 12 Months
Santa Barbara South County Number of Homes, Estates, and PUDs Sales Year-to-Date 2009 to 2026
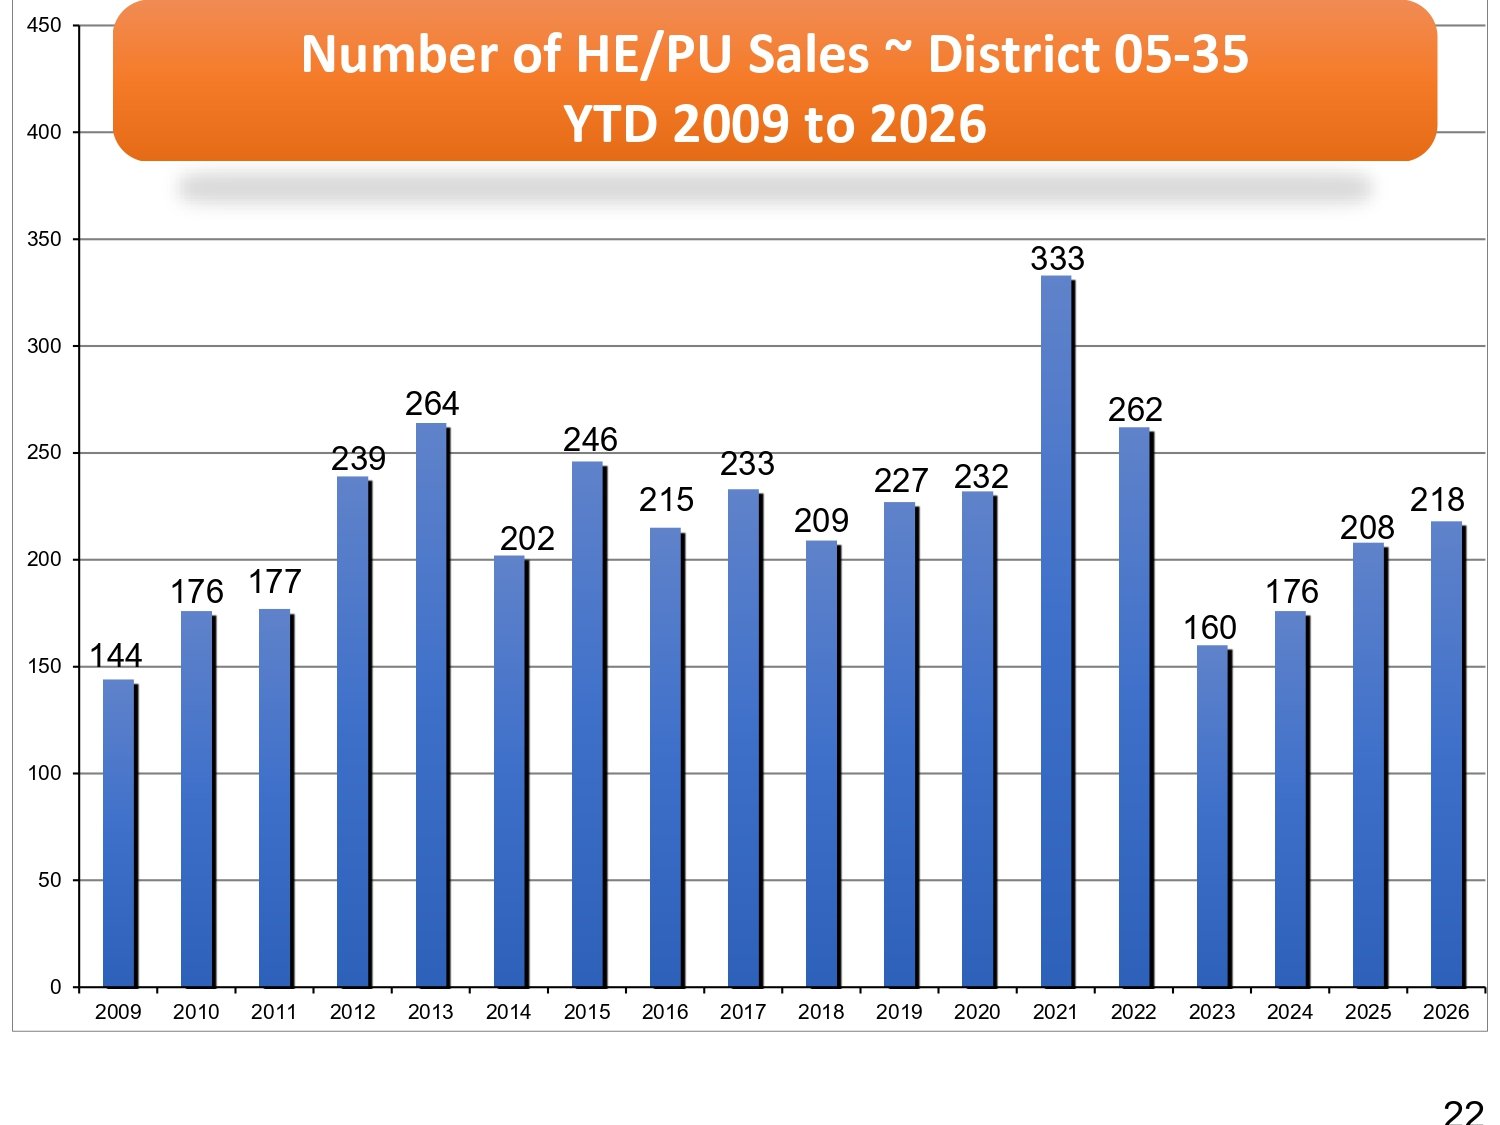
Santa Barbara South County Homes, Estates, and PUD Sales - Year-to-Date 2009 to 2026
Santa Barbara South County Homes, Estates, and PUD Sales - Month by Month
Santa Barbara South County Home, Estates, and PUD Median Sales Price - Month by Month
Partner with Locale Group for Your Real Estate Needs
Expertise and deep local knowledge are fundamental when evaluating property opportunities in Santa Barbara. Contact the team at Locale Group to receive a personalized analysis of your home value or to begin your search for a new residence.
Connect with the Locale Group today!
M: (805) 284-3660
E: [email protected]