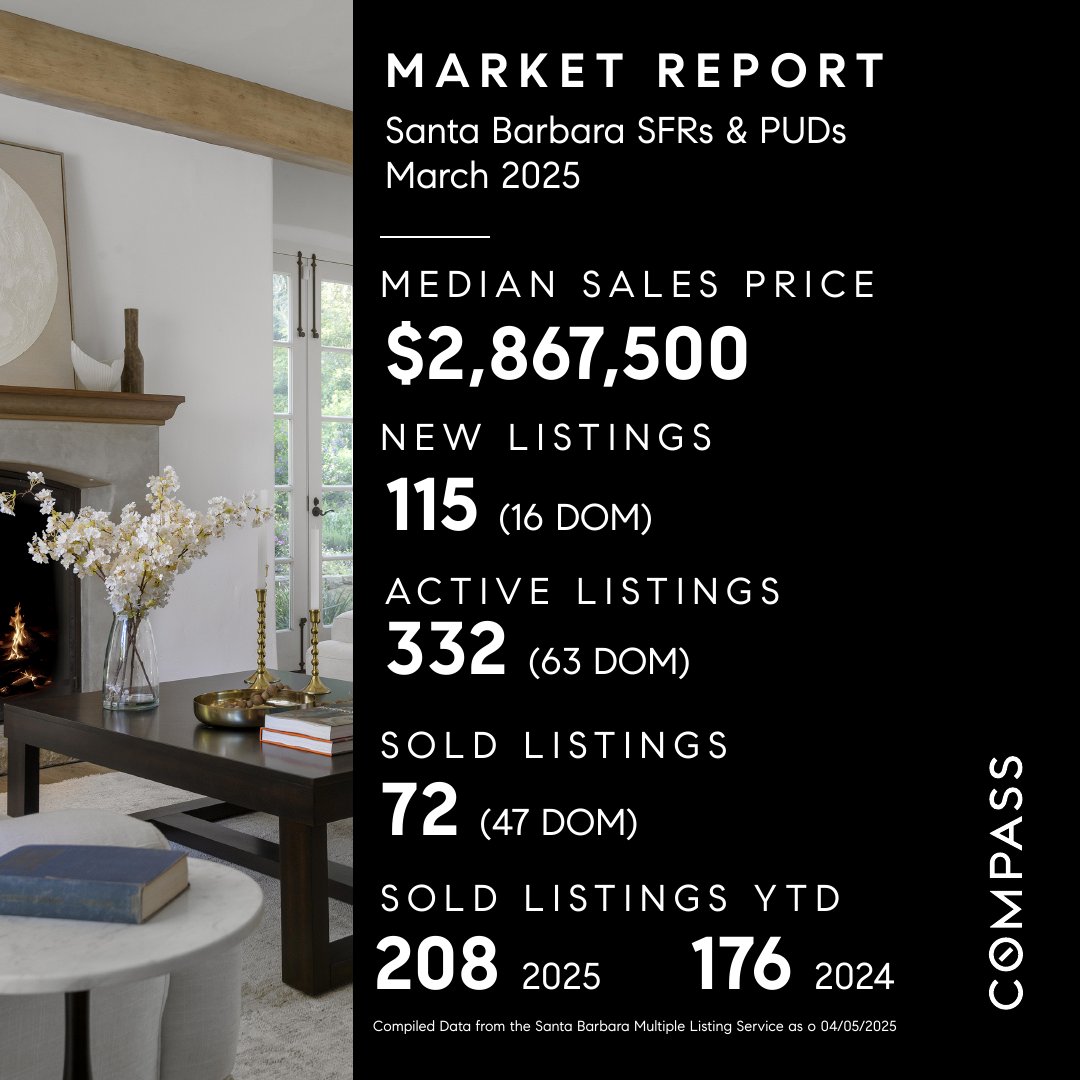
Santa Barbara South County MLS Statistics For March 2025
Real Estate Market Update
Here are the SB MLS Statistics for March 2025: https://sbaor.org/clientupload
Statistic Highlights:
-
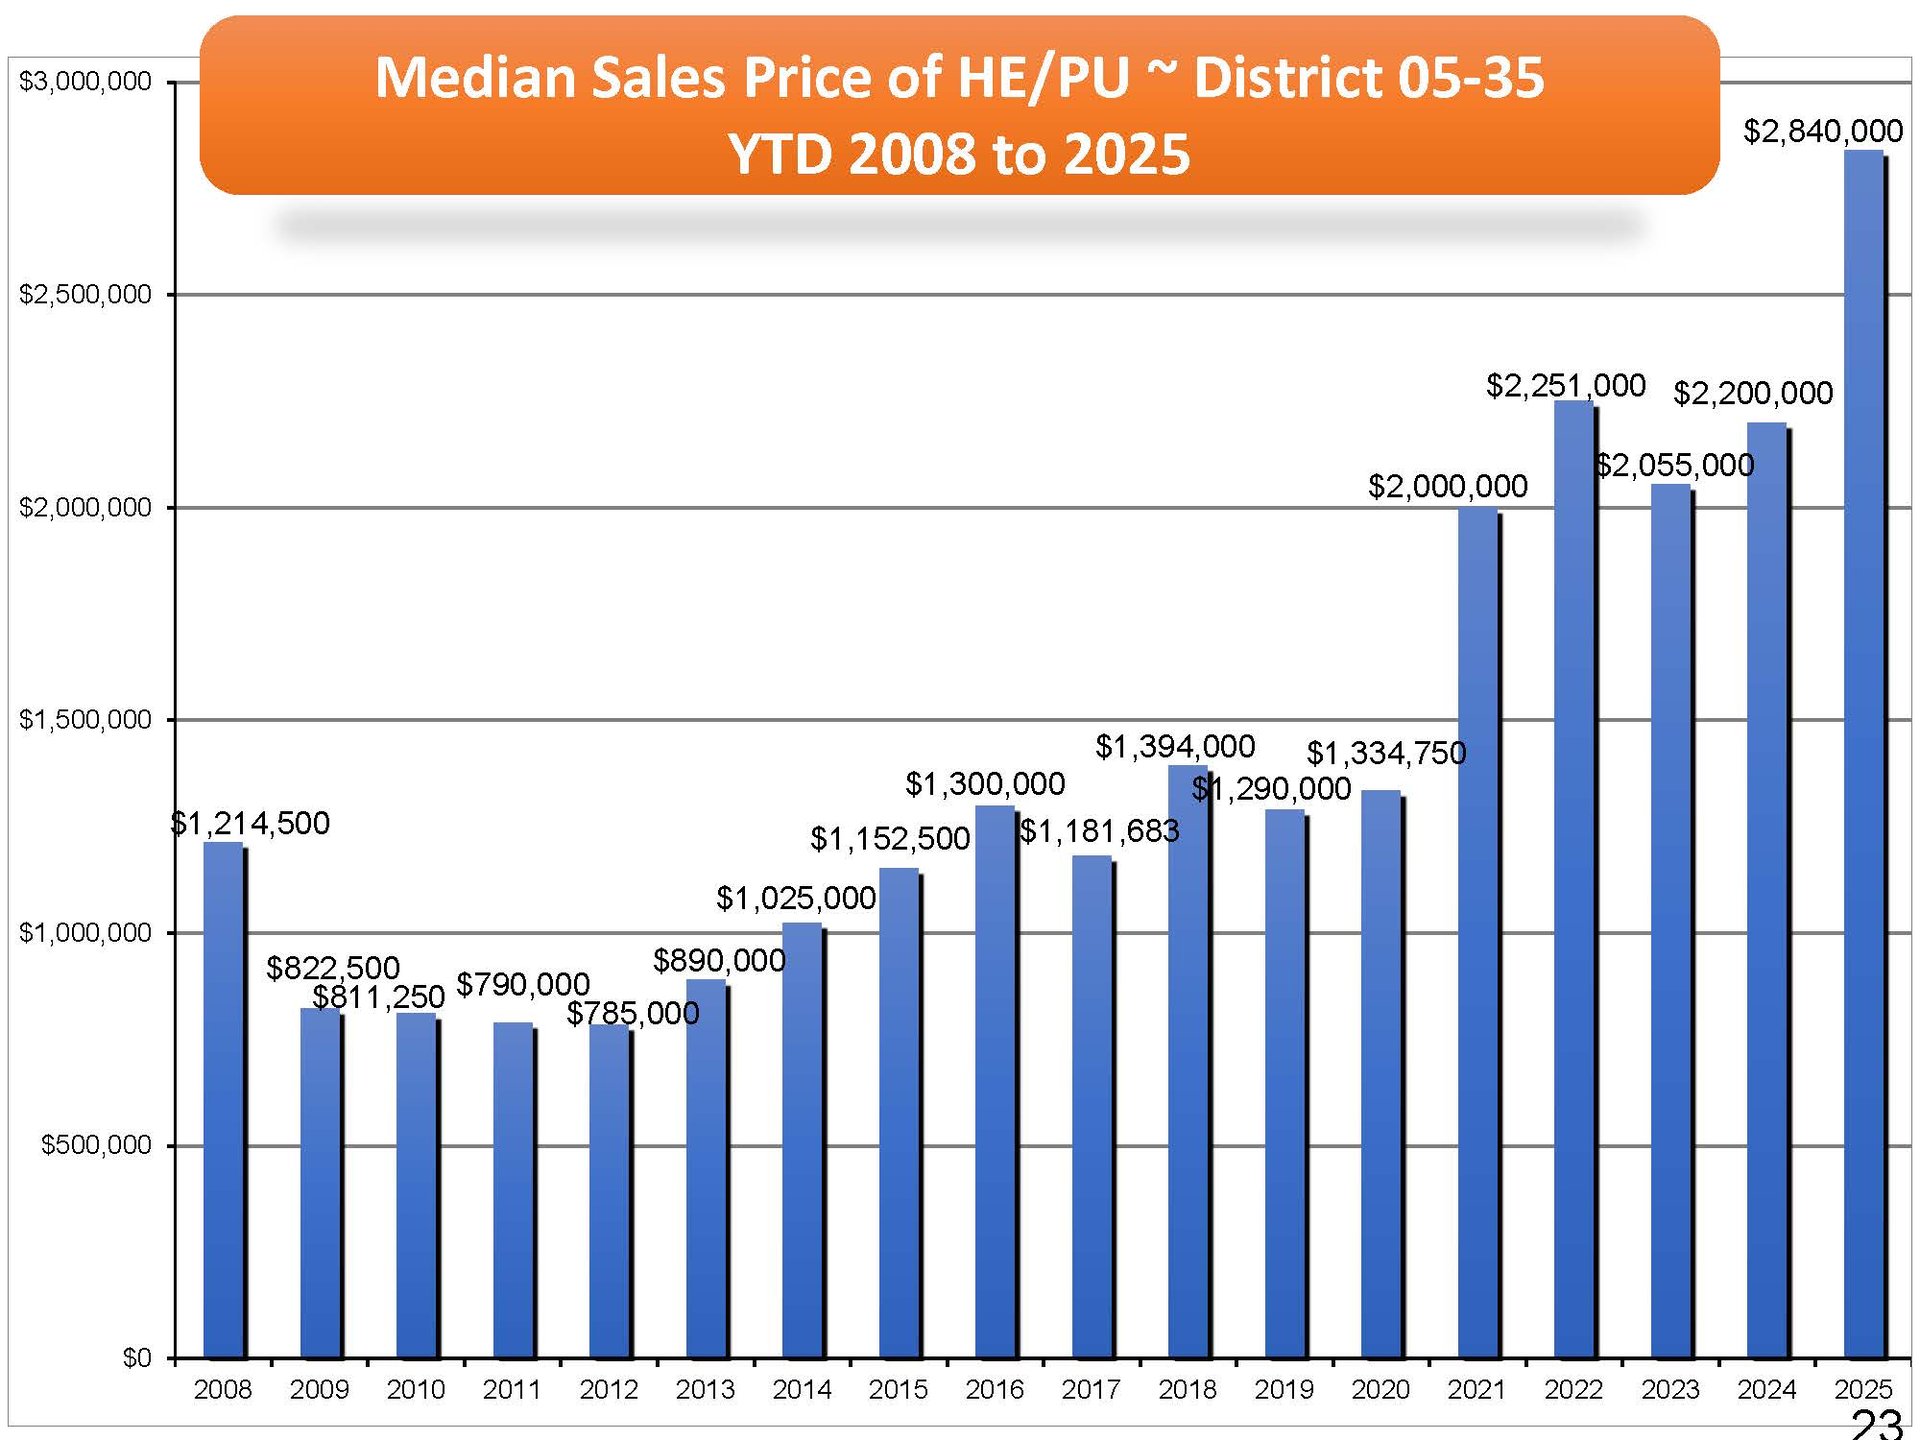
There's an increase in median sales price YTD - up 29.1% over last year: $2,220,000 (2024) to $2,840,000 (2025)
-
The average mortgage rate decreased slightly this week. Over the last couple of months, the 30-year fixed-rate mortgage has fluctuated less than 20 basis points, and this stability continues to bode well for buyers and sellers alike, according to Freddie Mac data.
-
March Sales 2025: SFR 72 (47 DOM) | Original List Price to Sales Price = 93.93%
-
March Sales 2024: SFR 73 (26 DOM) | Original List Price to Sales Price = 94.76%
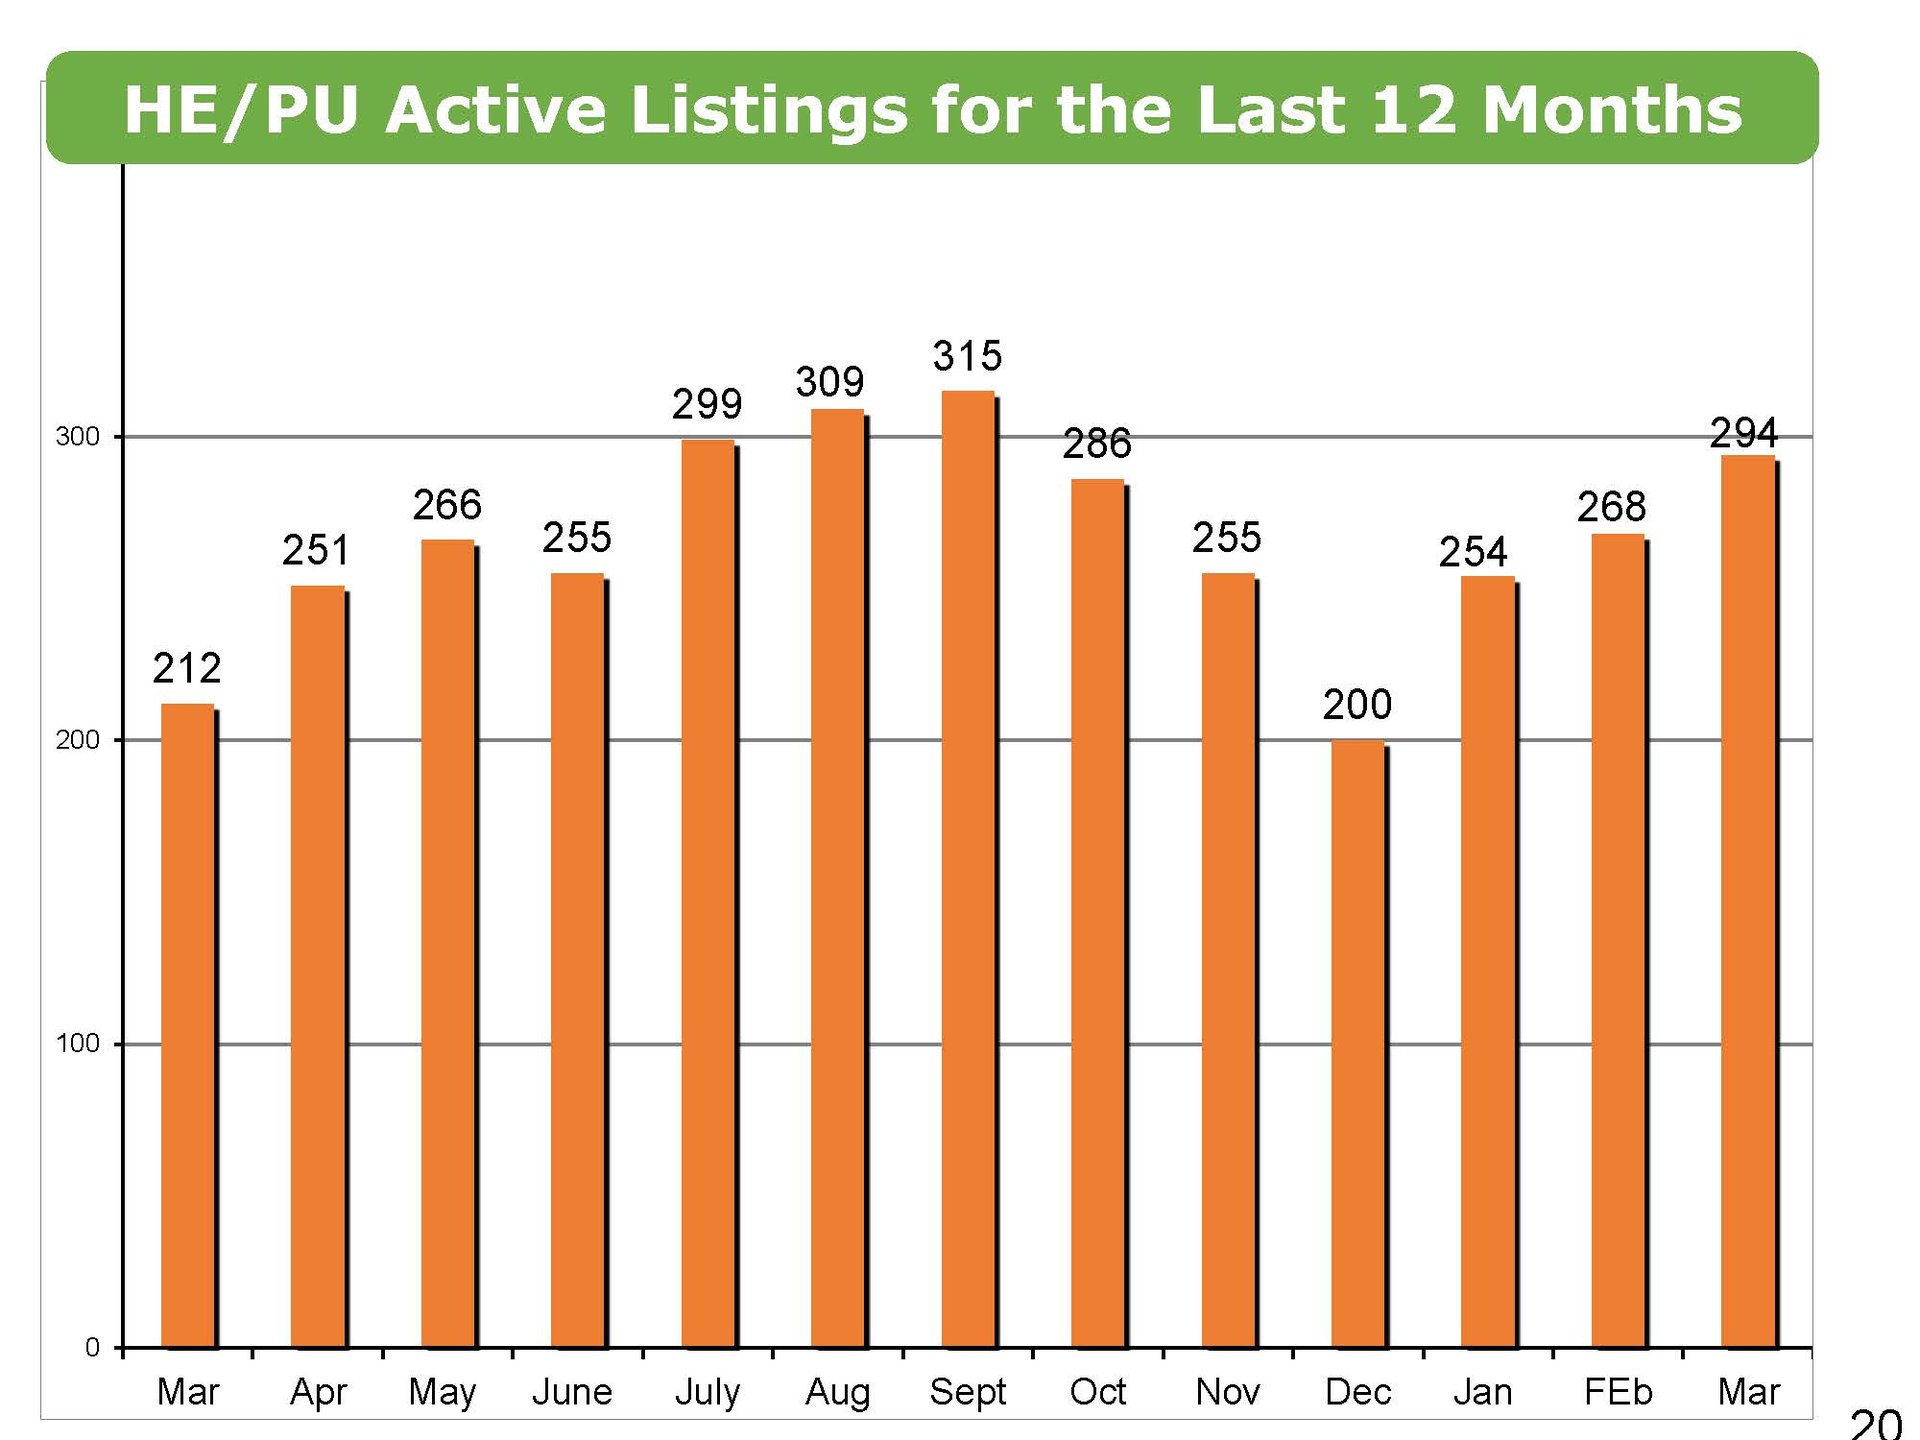
Santa Barbara South County Active Listings for the Last 12 Months
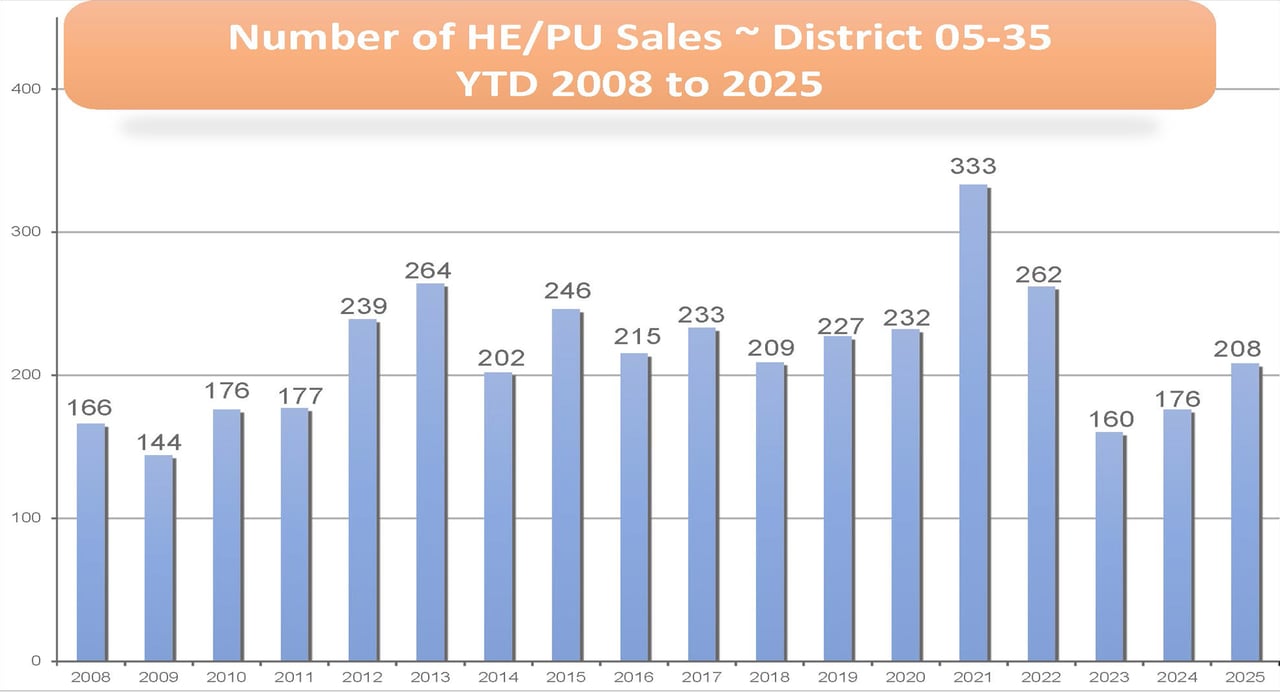
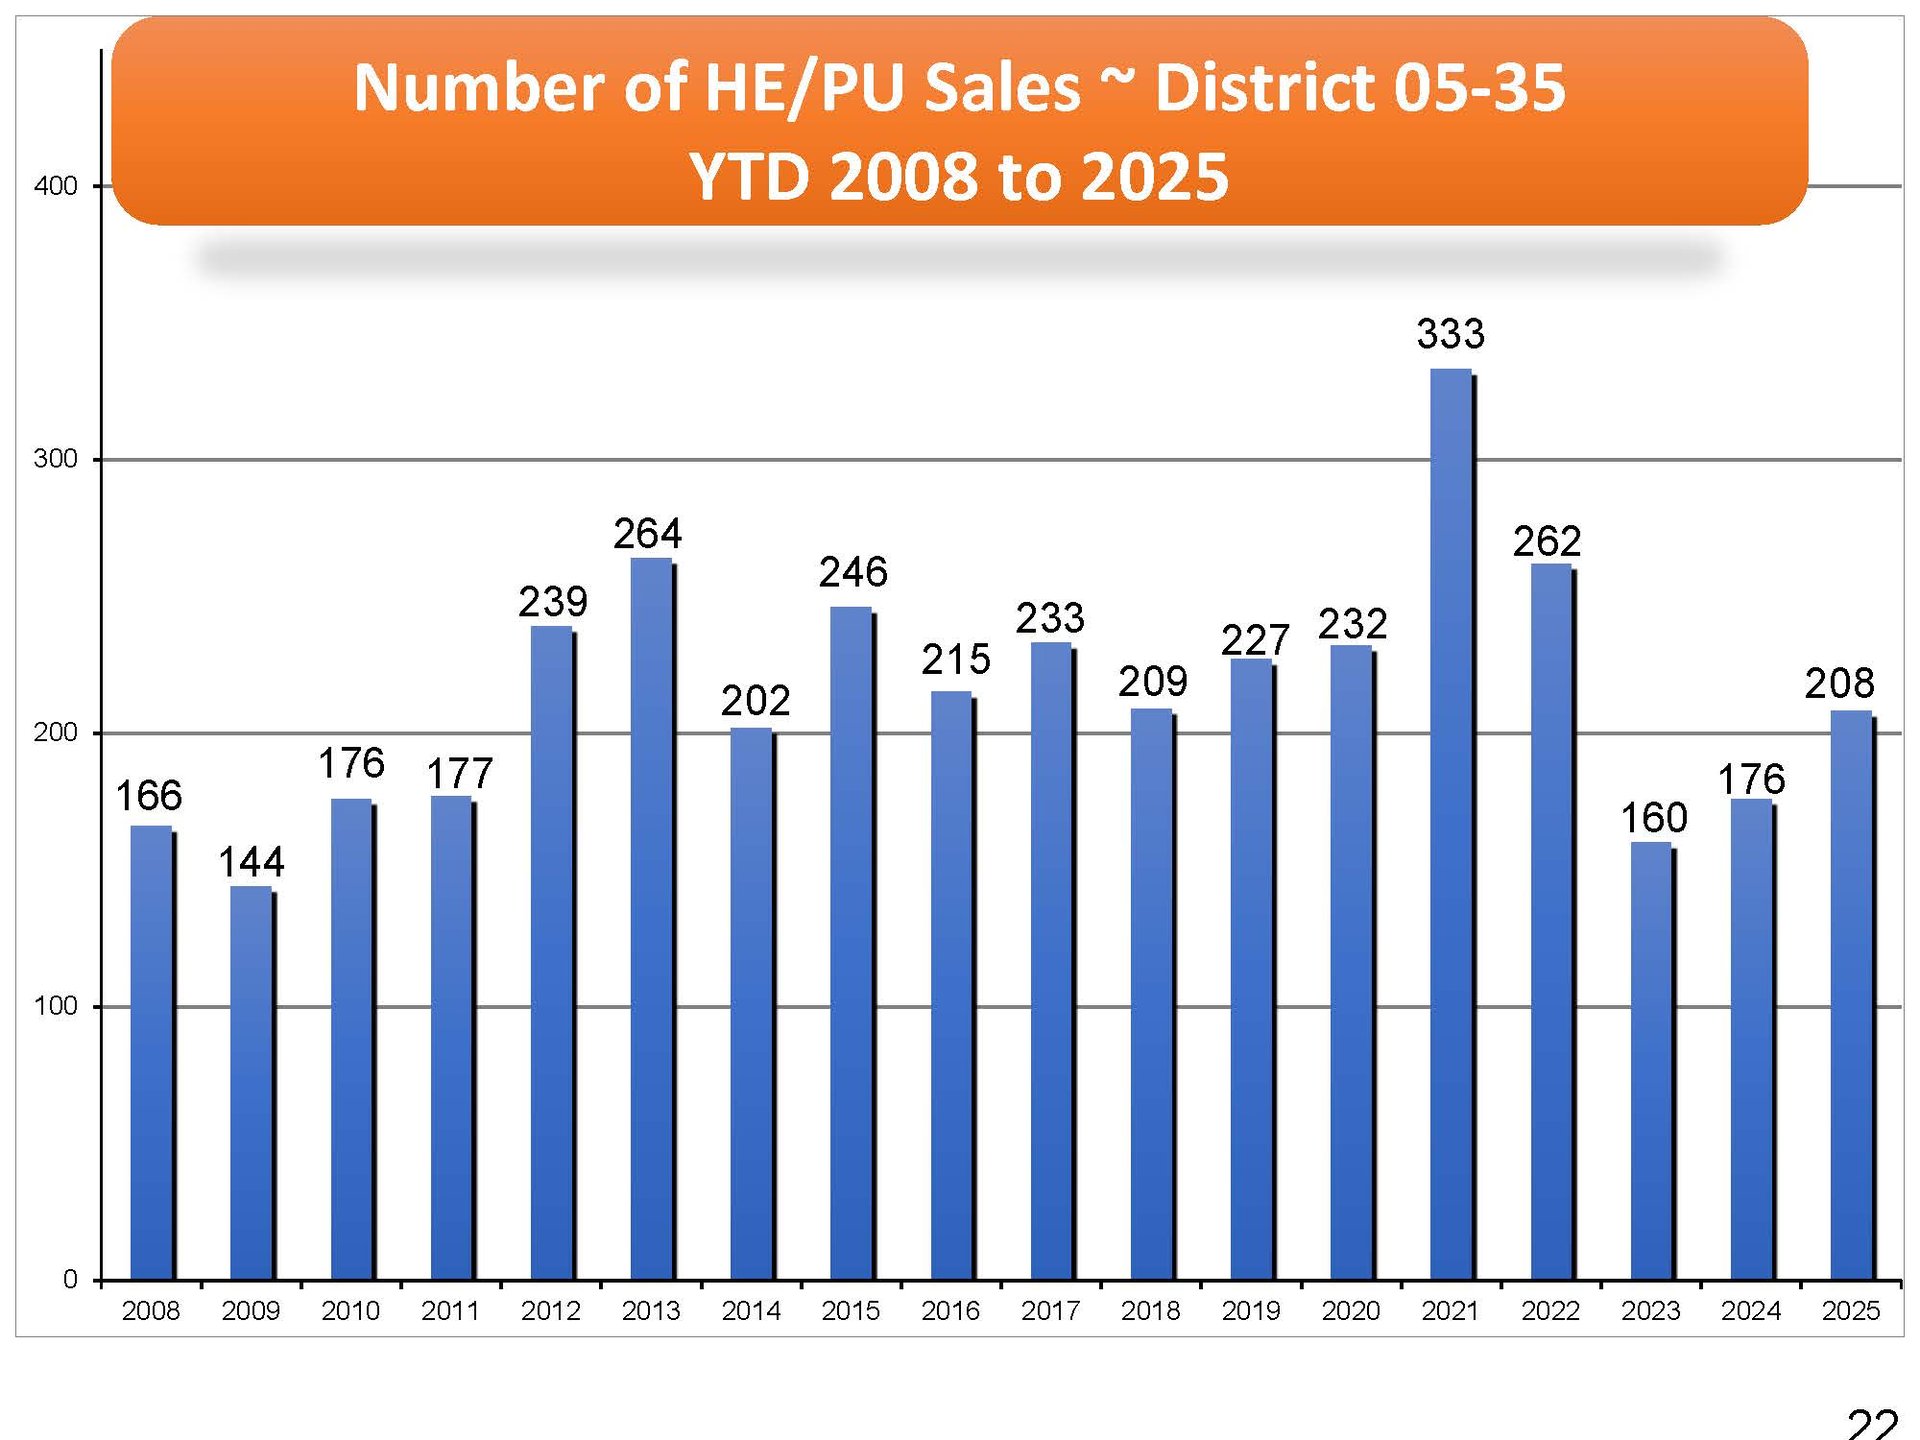
Santa Barbara South County Number of Homes, Estates, and PUDs Sales Year-to-Date 2008 to 2025
Santa Barbara South County Median Sales Price of Homes, Estates, and PUDs Year-to-Date 2008 to 2025
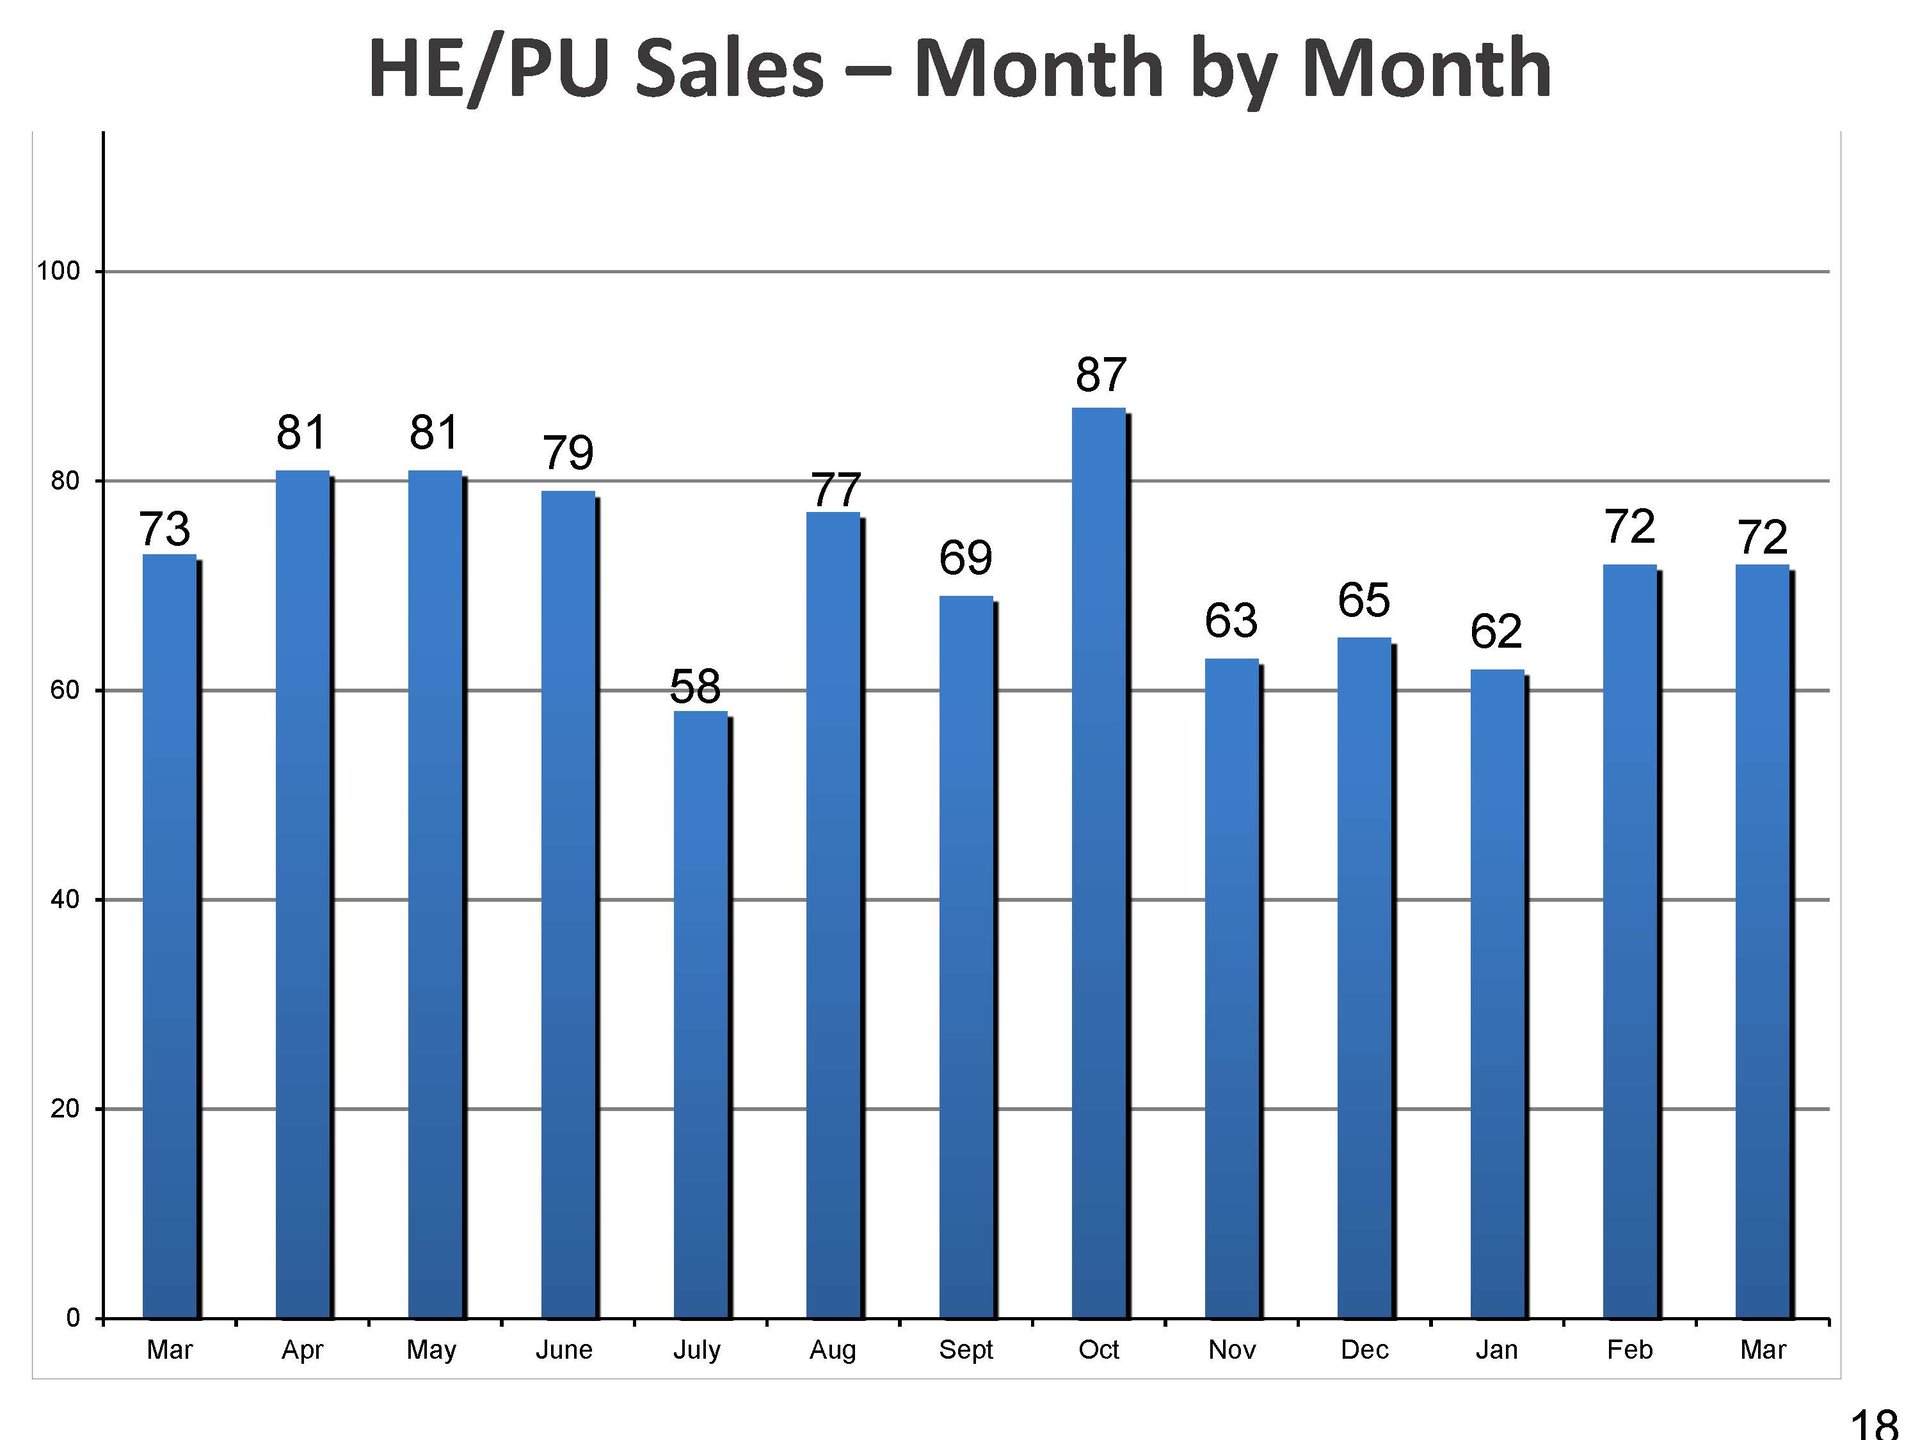
Santa Barbara South County Homes, Estates, and PUD Sales - Month by Month
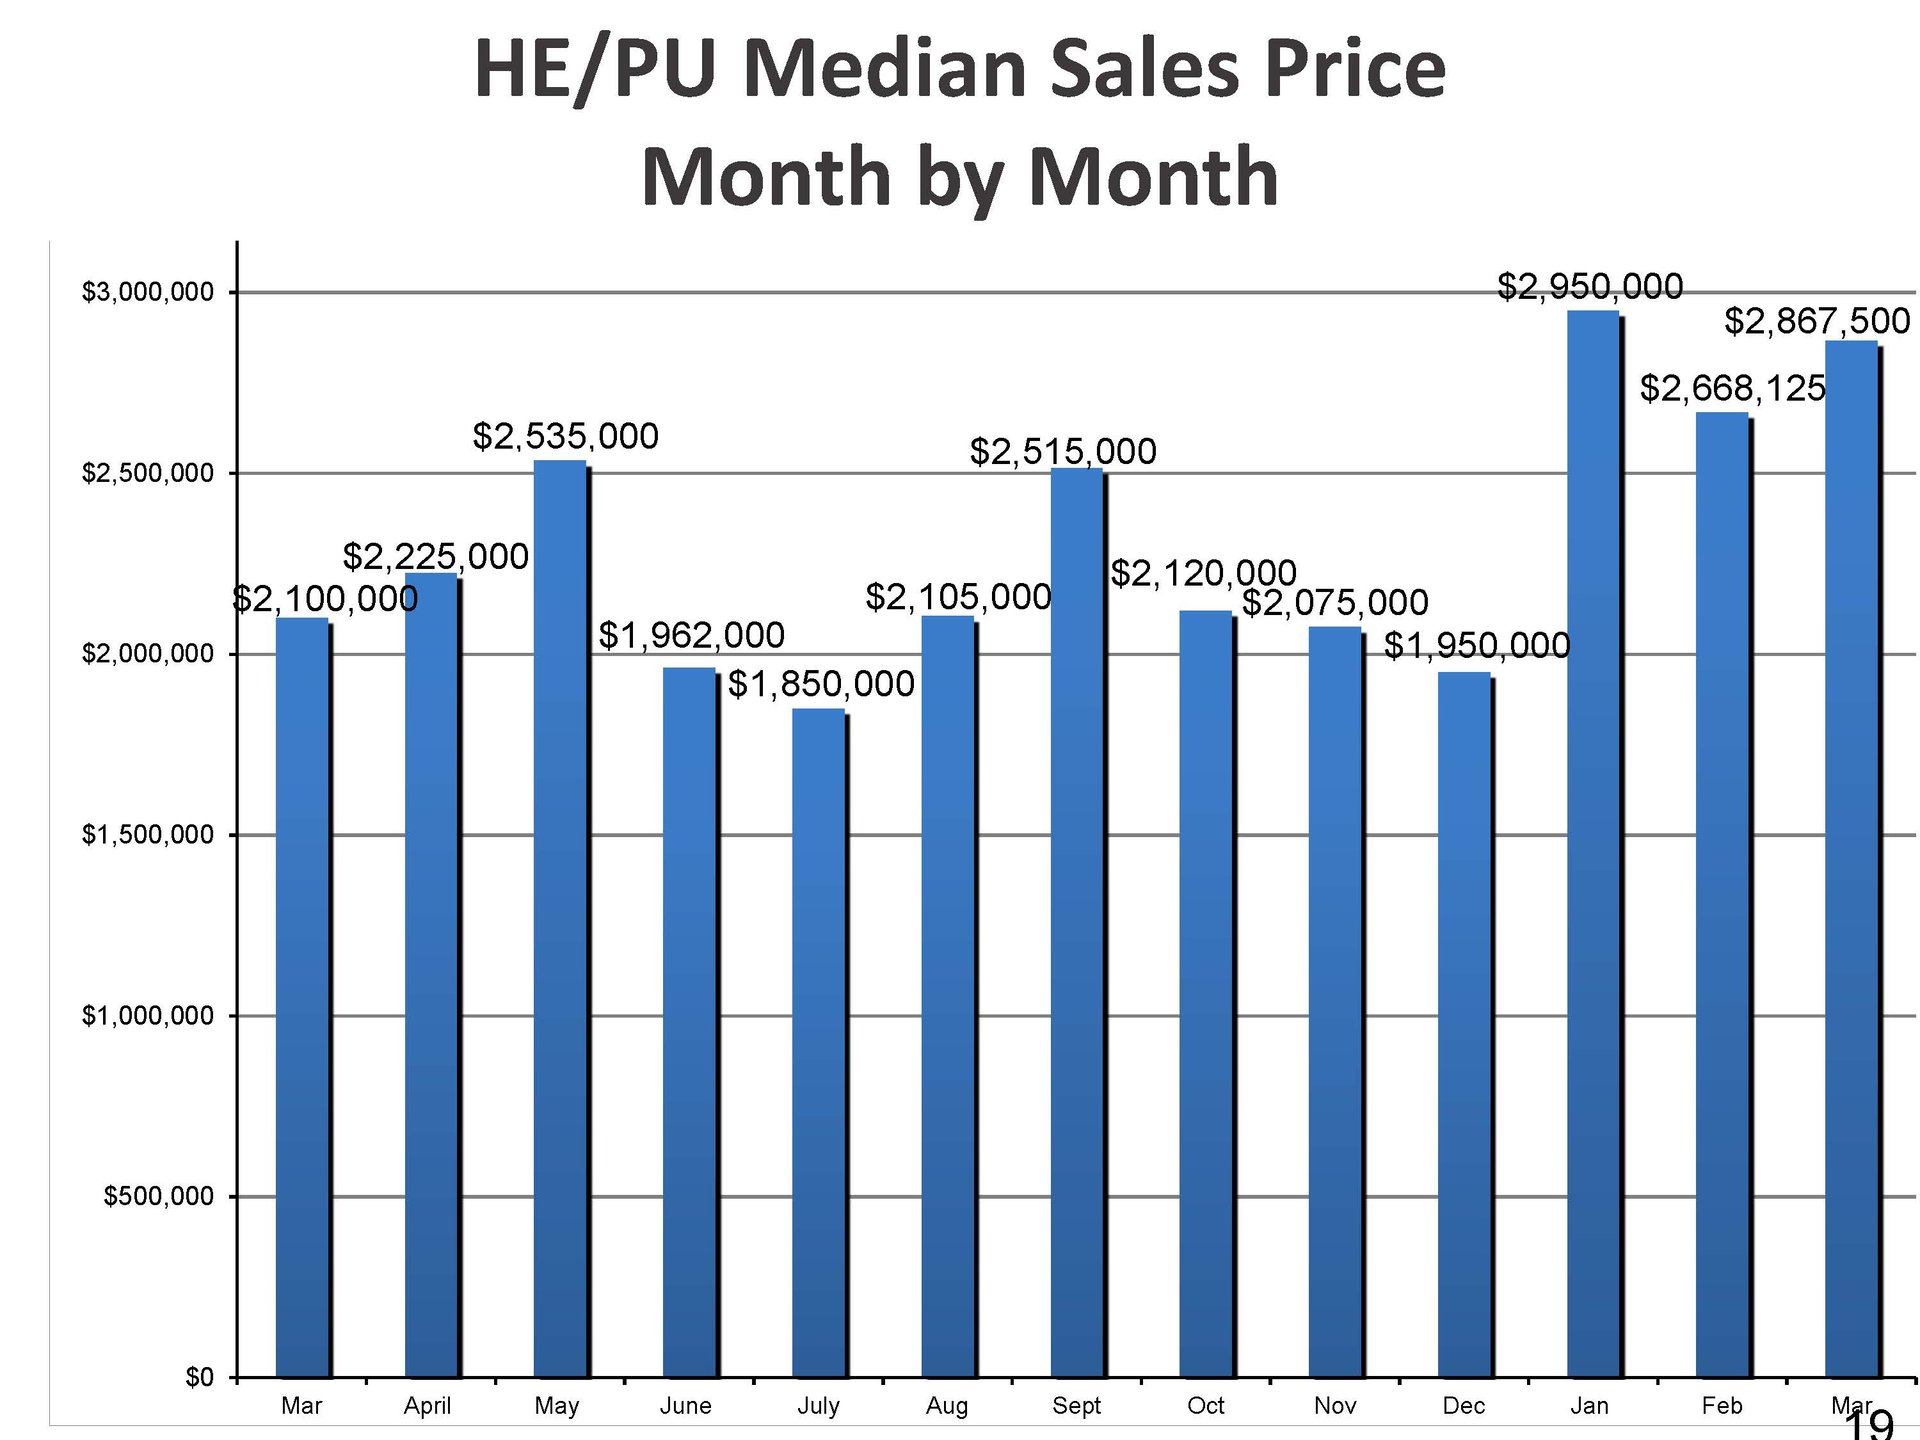
Santa Barbara South County Home, Estates, and PUD Median Sales Price - Month by Month
Contact us to receive a link to the in-depth Fidelity Title Report Santa Barbara, Montecito & Hope Ranch monthly and year-to-date statistics.
Call, text or email today!
(805) 284-3660
[email protected]