Santa Barbara South County MLS Statistics for July 2026
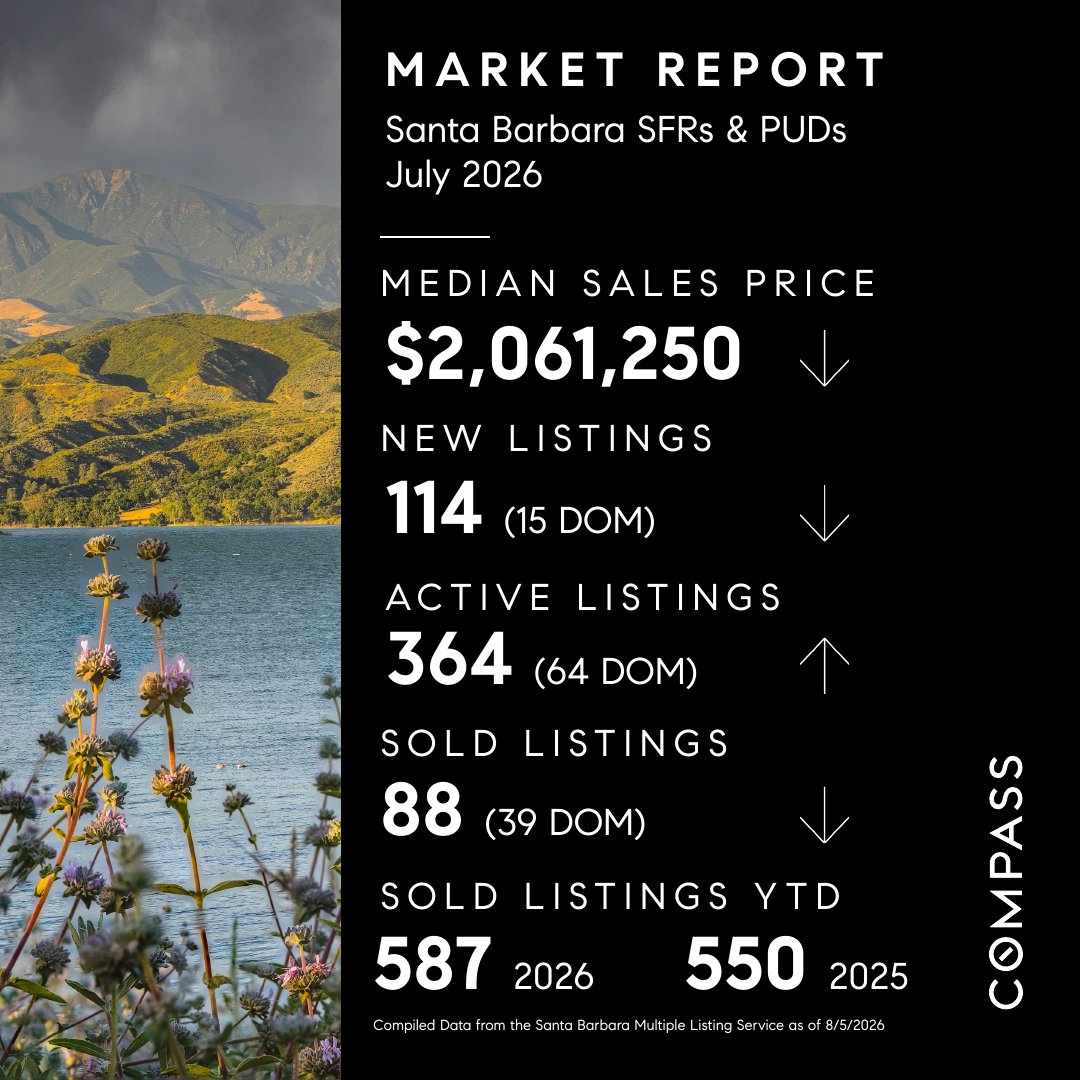
The Santa Barbara South County market is entering the second half of 2026 with an interesting combination of stronger transaction volume and softer pricing. More properties have sold this year than during the same period in 2025, yet median sales prices have moved lower, a shift that owes more to fewer high-end Hope Ranch and Montecito sales this July than to a broad decline in what typical homes are worth.
Here is the Santa Barbara MLS Statistics for July 2026: SBAOR Monthly MLS Statistics - July 2026
Stronger Sales Activity Pointed to Resilient Single-Family Demand
The year-to-date numbers for Home Estate/PUD properties show that lower pricing has not translated into slower sales. Instead, the market has recorded more closings and more escrow activity, with total sold volume also moving higher, creating a notable contrast between transaction growth and price movement.
- 587 properties sold, compared with 550 at this point in 2025, a 6.7% increase
- 622 properties entered escrow, compared with 583, also up 6.7%
- $2.06 billion in sold volume, up 4.4% from $1.97 billion
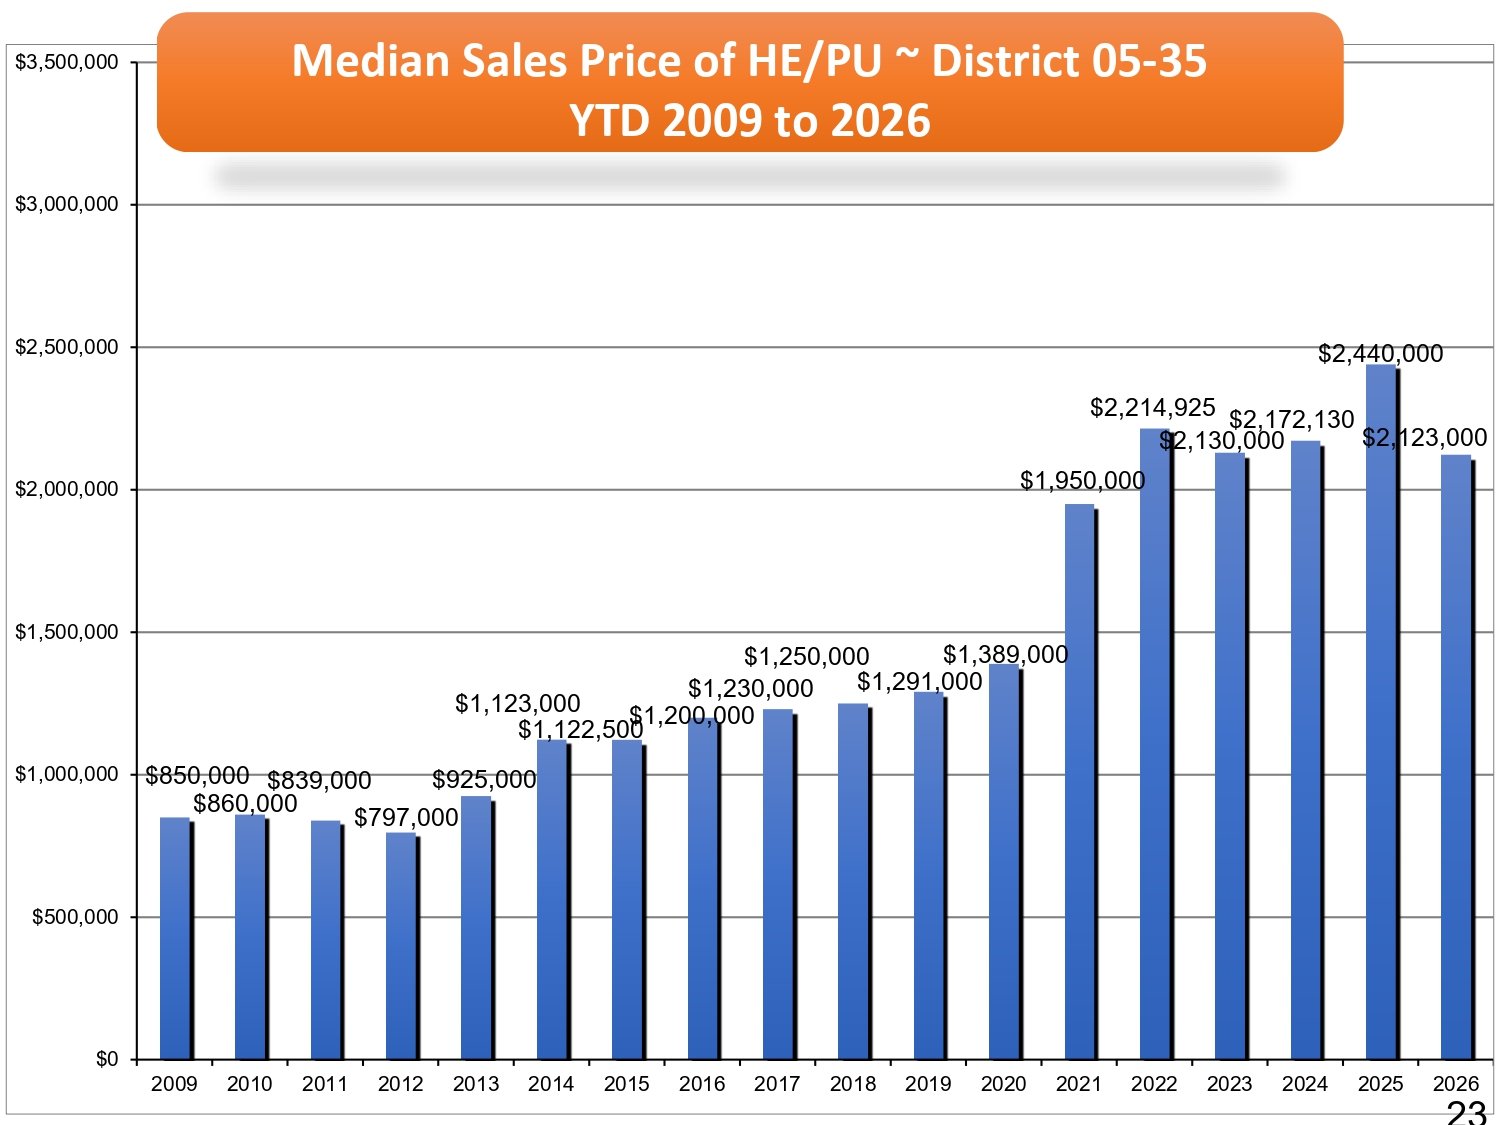
- $2,123,000 median sales price, down 13% from $2.44 million
- $3,506,002 average sold price, down 2.2%
The numbers suggest a market that is recalibrating rather than losing momentum. Buyers are completing more transactions at current price levels, while the increase in overall sold volume shows that significant value continues to move through the market.
Condo Sales Outpaced Last Year as Prices Settled
Condos are showing a slightly different version of the same story, with sales increasing at a faster rate than single-family homes while pricing has moderated from 2025. The increase in completed sales indicates that buyers continue to see opportunities within the segment, even as lower prices have reduced overall sold volume.
- 214 condos sold year to date, up 9.2% from 196
- 210 properties entered escrow, up 1.4% from 207
- $985,000 median sales price, down 4.4%
- $1,207,296 average sold price, down 10.4%
- $258.36 million in sold volume, down 2.2%
The increase in transactions is the clearest sign of continued condo demand, while the pricing figures show that buyers remain sensitive to value. For sellers, current pricing and positioning can have a meaningful impact on how a property performs against its competition.
Steady Inventory Kept the Market Competitive
The year-to-date inventory has not expanded enough to create a major shift in supply, which helps explain why sales activity can strengthen even as prices moderate. Home Estate/PUD active listings are slightly below last year, while condo inventory is virtually unchanged, leaving available supply relatively close to 2025 levels.
- 842 active Home Estate/PUD listings, down 1.5%
- 833 new Home Estate/PUD listings, down 3.8%
- 275 active condo listings, up 0.7%
- 271 new condo listings, down 2.9%
- 39 days average market time for July Home Estate/PUD sales
- 25 days average market time for July condo sales
The inventory picture does not suggest an oversupplied market. With supply holding relatively steady and sales increasing, accurate pricing and strong property positioning remain important factors in attracting buyers.
Buyers Gained Room to Evaluate While Sellers Faced Greater Pricing Sensitivity
With median sales prices lower than last year, buyers have more room to assess pricing and compare opportunities across the market. That added leverage hasn't come with slower sales. Single-family homes sold in an average of 39 days this July, down from 43 days last year, and condos sold in 25 days, down from 31, showing that buyers who find the right value are still moving quickly once they do.
At the same time, sellers are operating in a market where current comparable sales carry greater weight. The faster market times this year suggest that well-priced properties are finding motivated buyers efficiently, and thoughtful pricing and positioning remain the clearest way for a listing to stand out from its competition.
Santa Barbara South County Home Estates, and PUD Active Listings for the Last 12 Months
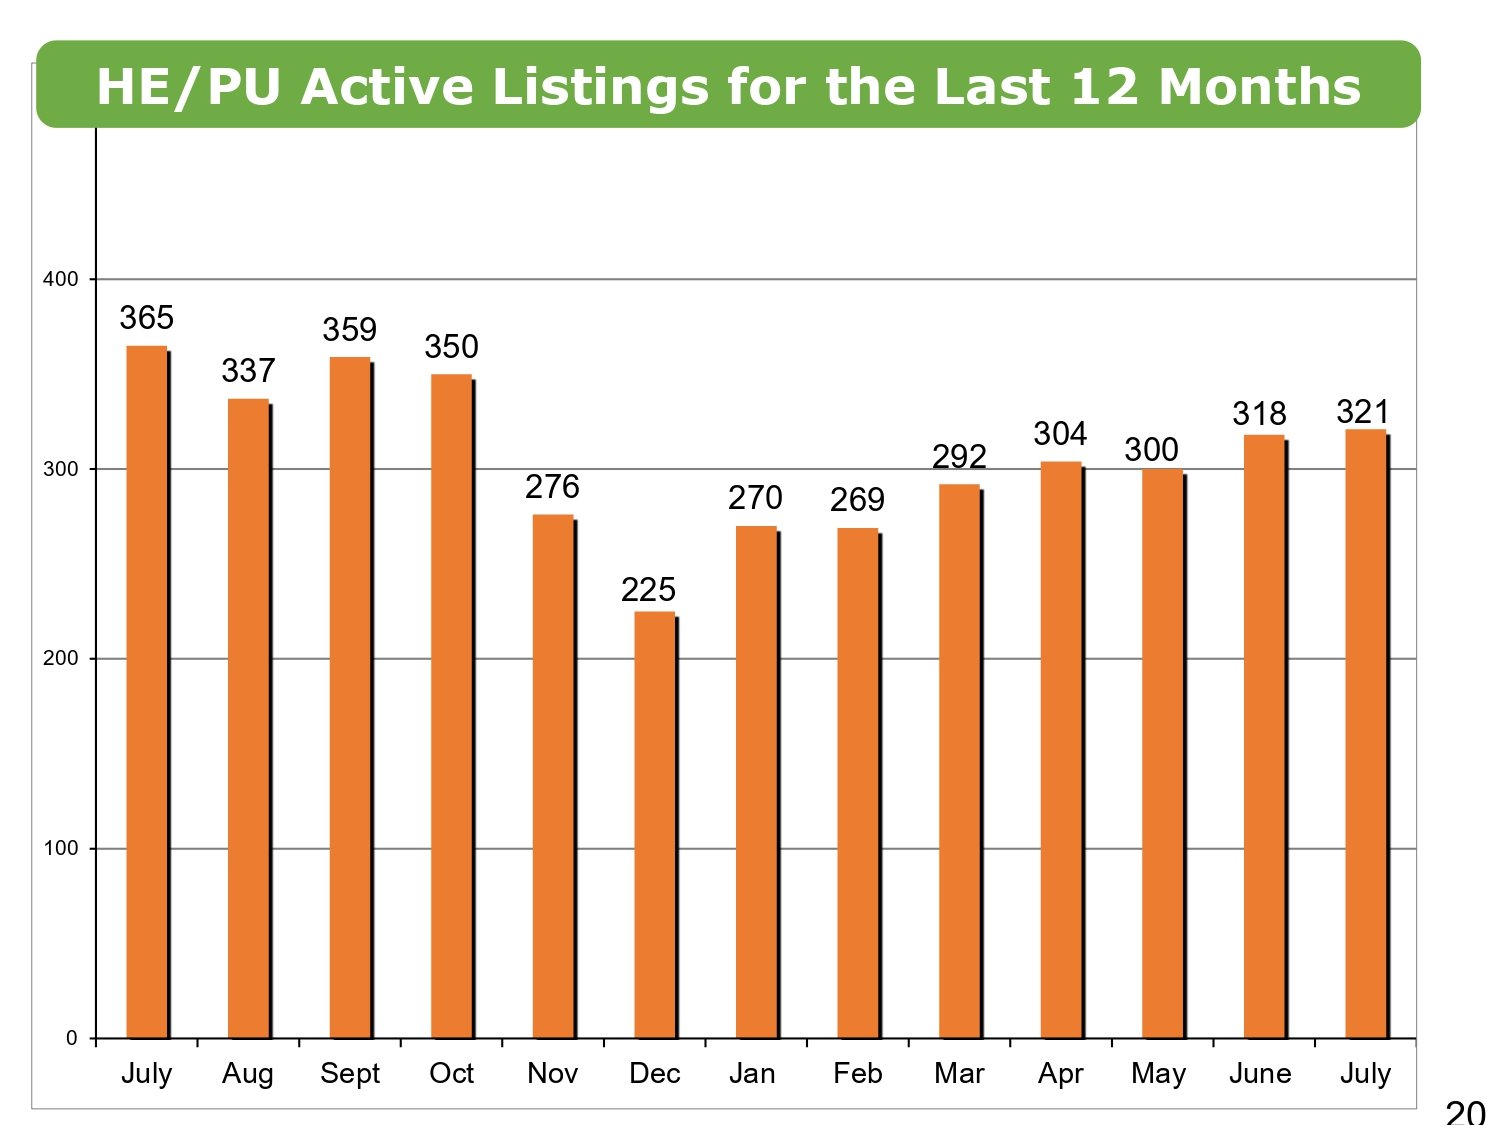
Santa Barbara South County Number of Homes, Estates, and PUDs Sales Year-to-Date 2009 to 2026
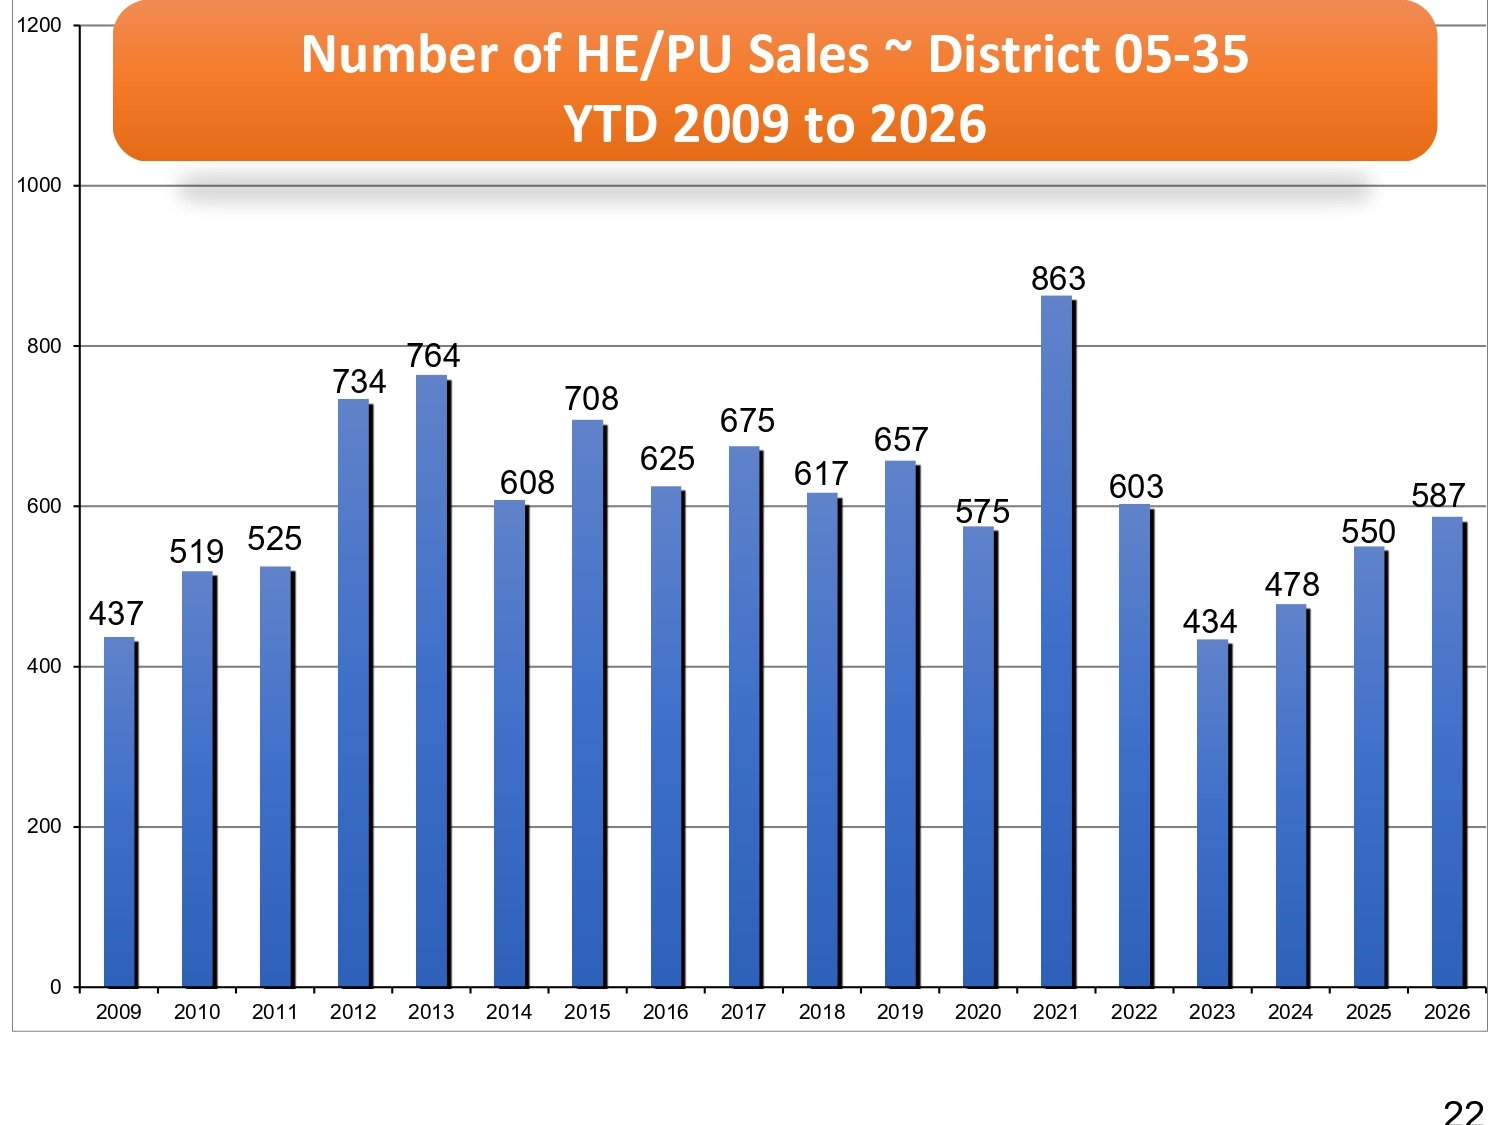
Santa Barbara South County Homes, Estates, and PUD Sales - Year-to-Date 2009 to 2026
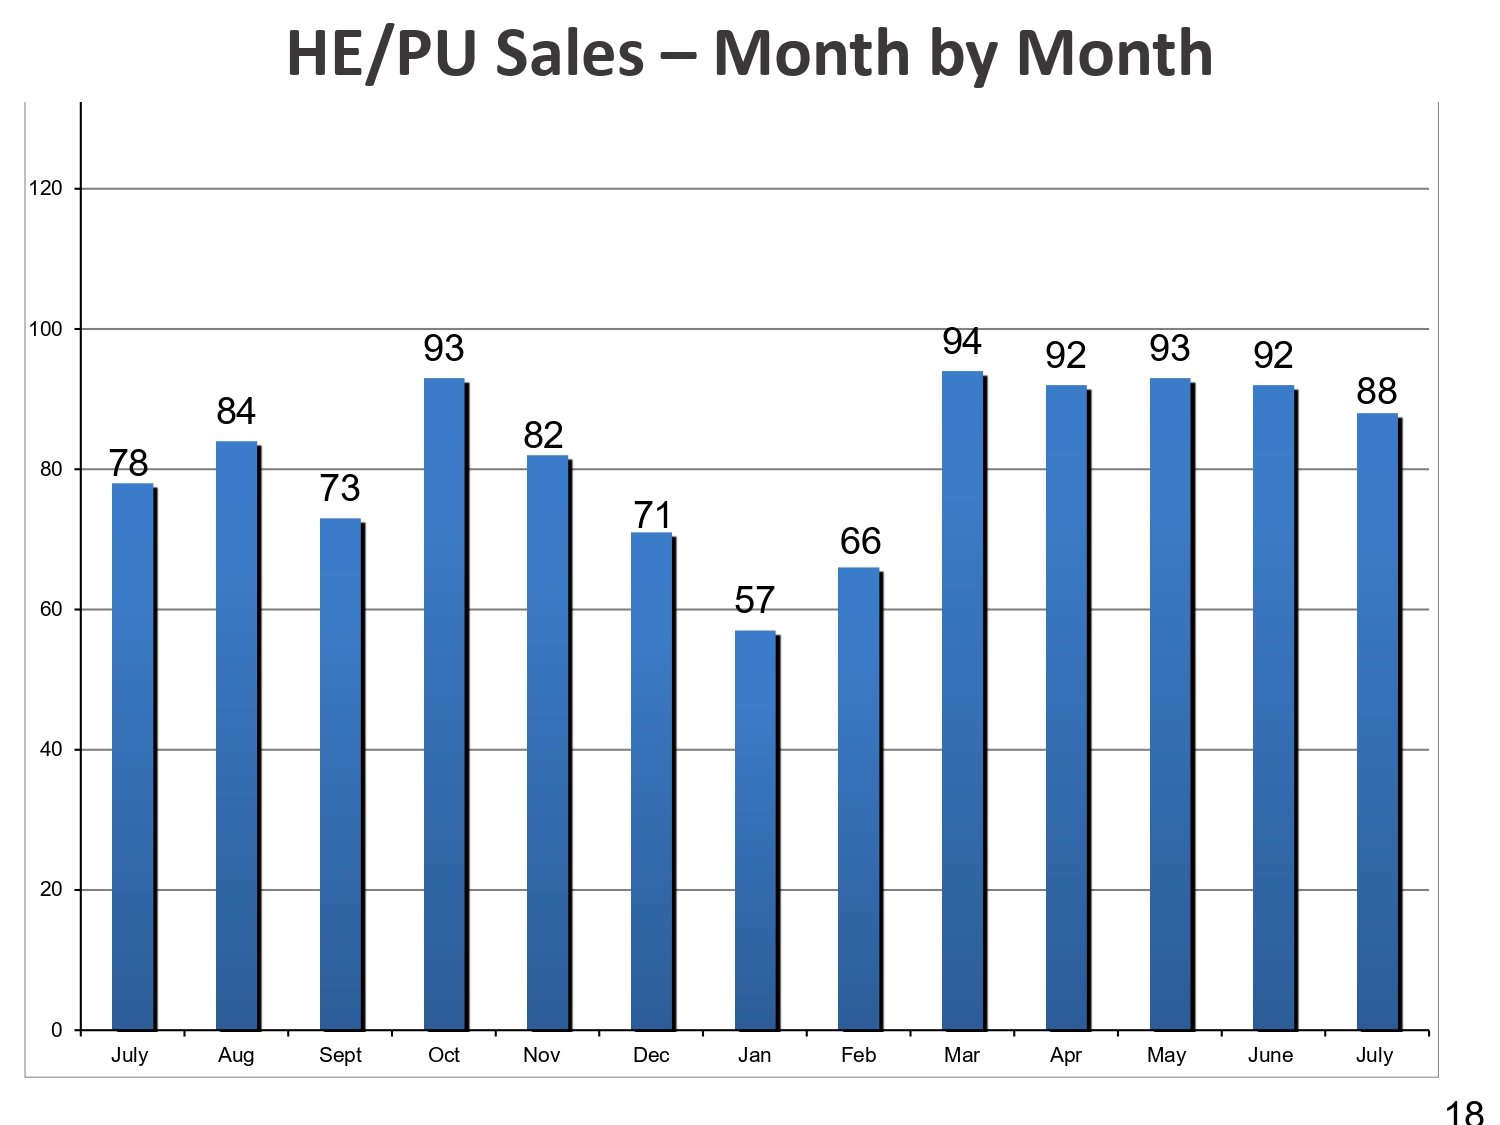
Santa Barbara South County Homes, Estates, and PUD Sales - Month by Month
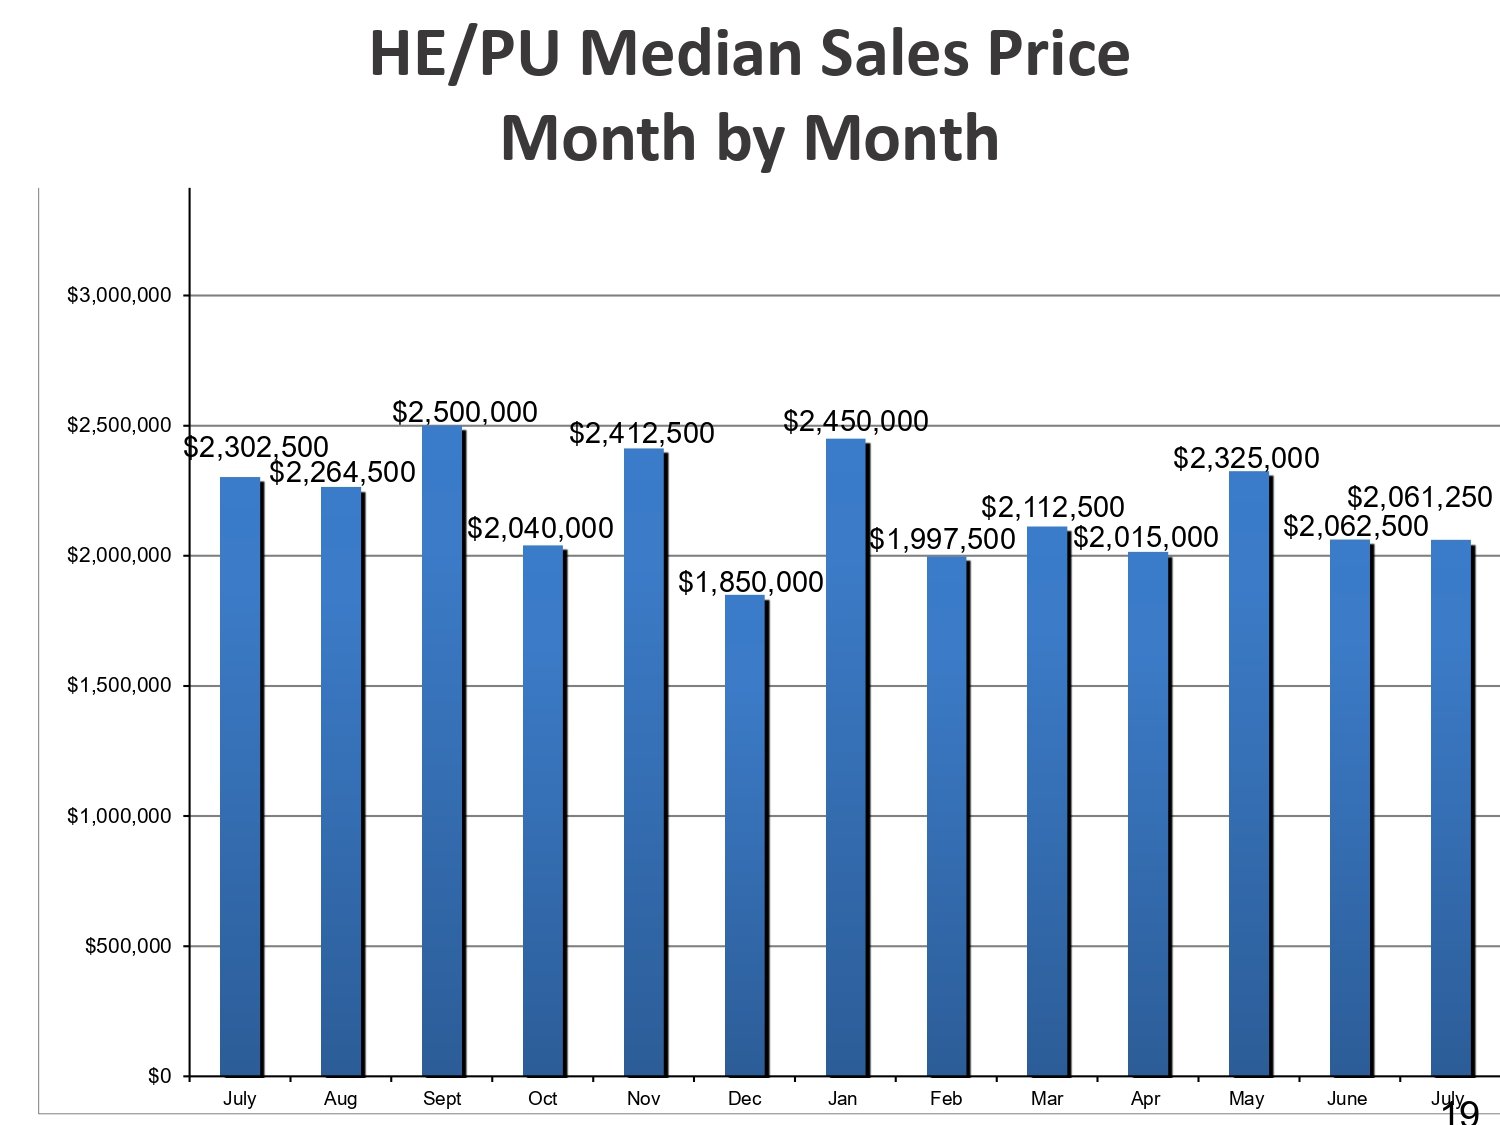
Santa Barbara South County Home, Estates, and PUD Median Sales Price - Month by Month
Local Expertise Brings the Numbers Into Focus
Countywide statistics provide a useful view of the market, but they do not tell the whole story of what is happening from one neighborhood or property to the next. Locale Group brings together current MLS data, local knowledge, and extensive experience across Santa Barbara and Montecito to help clients understand the details behind the numbers and make informed real estate decisions.
Connect with Locale Group for a closer look at what the latest market data means for your property or real estate goals.

M: (805) 284-3660
E: [email protected]