Santa Barbara South County MLS Statistics For August 2024

Santa Barbara South County MLS Statistics For August 2024
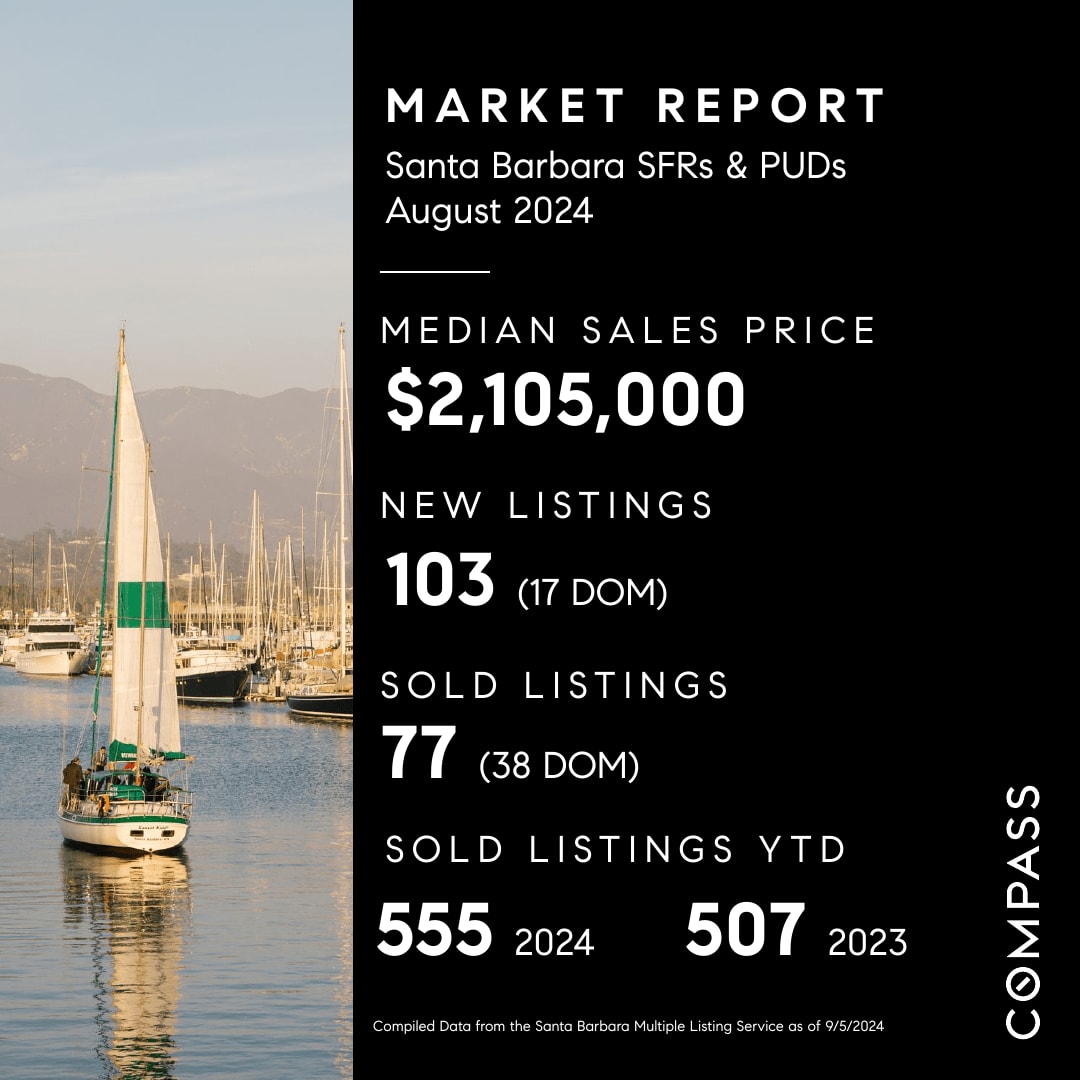
Santa Barbara South County MLS Statistics For August 2024

Santa Barbara August 2024 housing market report with sales statistics beside a sailboat in a marina.

Click here for the complete Santa Barbara MLS August Statistics.


Santa Barbara South County Active Listings for the last 12 Months

Bar chart of HE/PU active listings, rising from 229 in August to 309 the following August after a December low of 156.

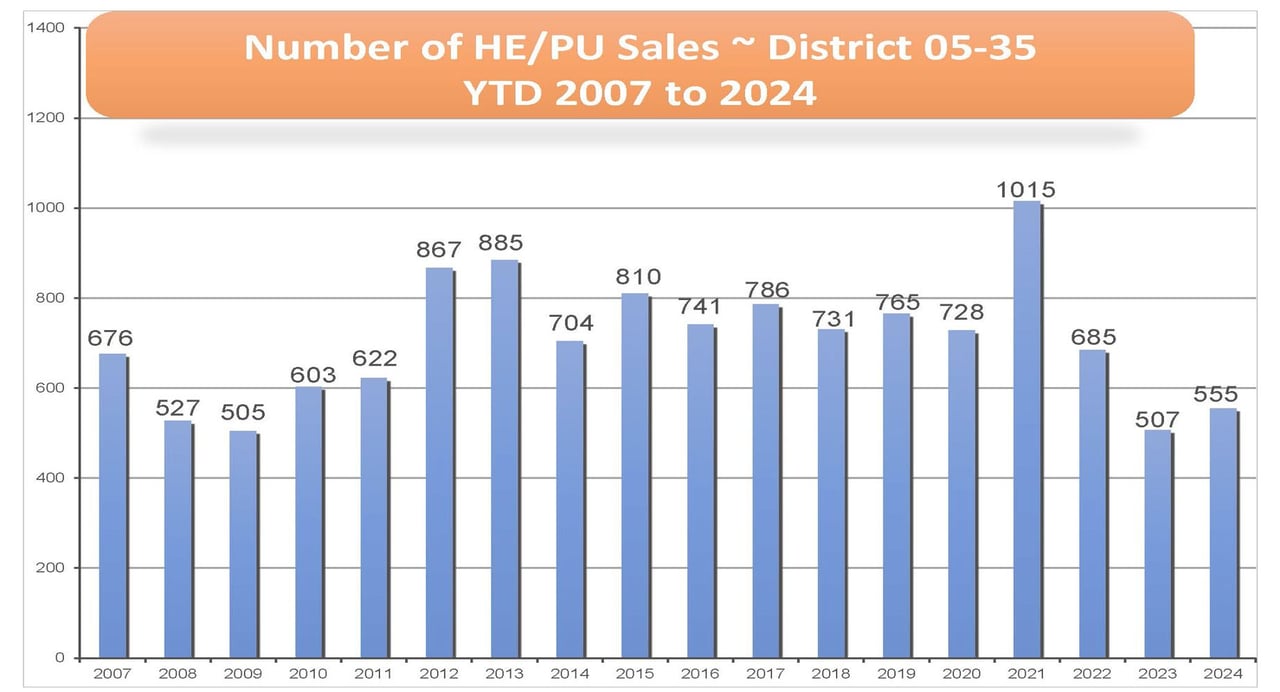
Santa Barbara South County Number of Home, Estate, and PUD Sales Year-to-Date 2007 to 2024

Bar chart of District 05-35 HE/PU sales, YTD 2007–2024; peak is 1,015 in 2021.

Santa Barbara South County Median Sales Price of Home, Estates, and PUDs Year-to-Date 2007 to 2024
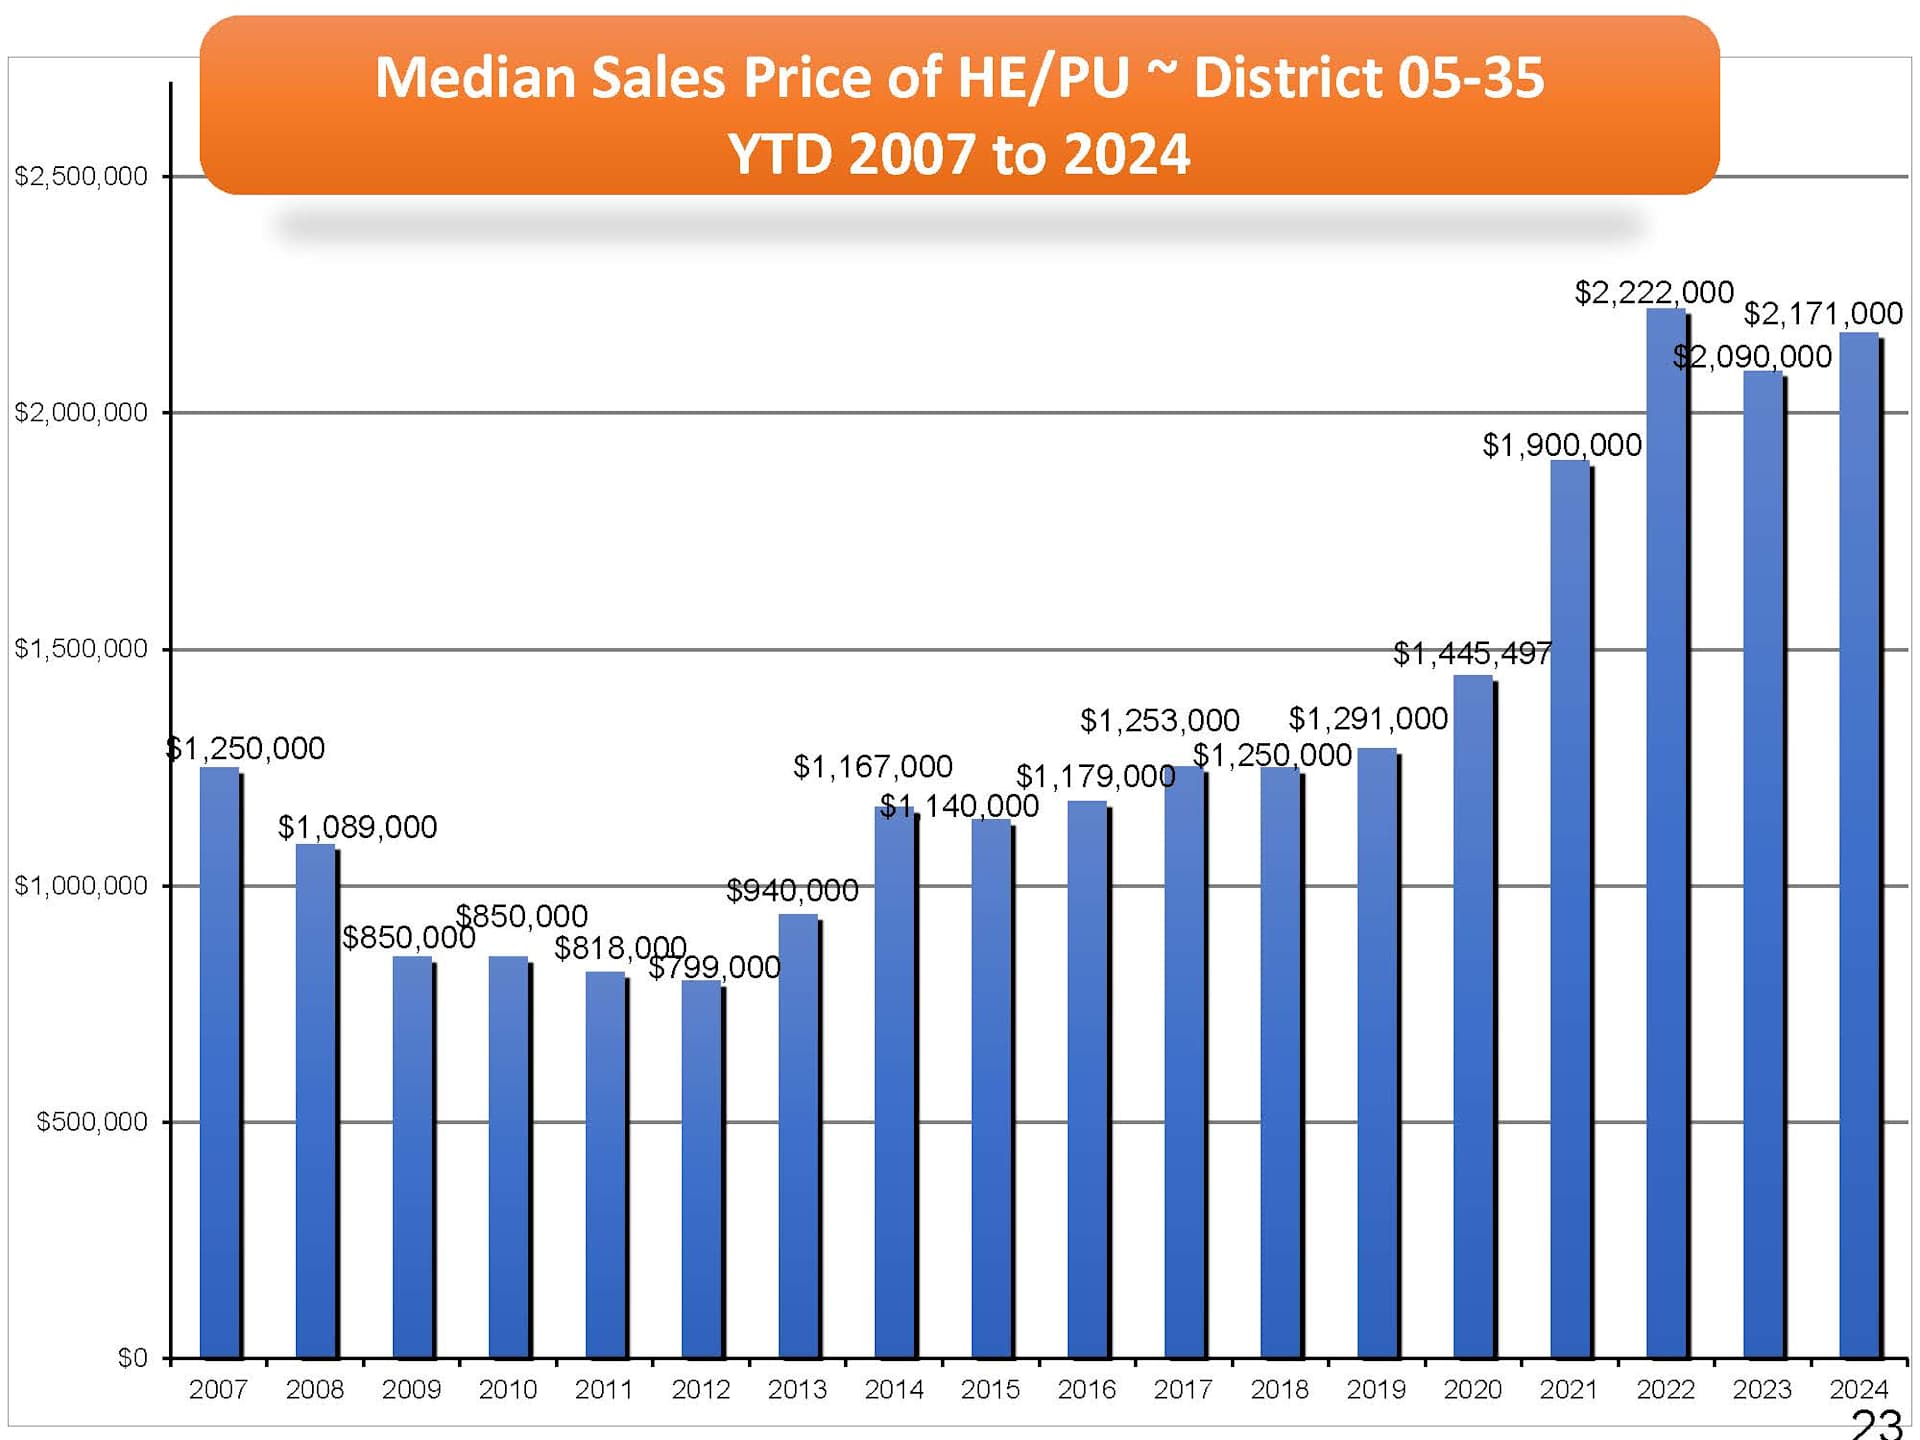
Bar chart of District 05-35 year-to-date median sales prices from 2007 to 2024, peaking at $2.222 million in 2022.


Santa Barbara South County Home, Estates, and PUD Sales - Month by Month

HE/PU monthly sales bar chart, rising to 81 in April and May before dipping in July.

Santa Barbara South County Home, Estates, and PUD Median Sales Price - Month by Month

Chart of monthly HE/PU median sales prices, peaking at $2,535,000 in May and ending at $2,105,000 in August.


Contact us to receive a link to the in-depth Fidelity Title Report Santa Barbara, Montecito & Hope Ranch monthly and year-to-date statistics.


Call, text or email today!
(805) 284-3660
[email protected]


Work With Us

We pride ourselves on high service standards, creative marketing, and technological expertise. To find out more please reach out and we'll be in touch quickly.

Follow Us on Instagram