Santa Barbara South County MLS Statistics For April 2026
The real estate landscape in Santa Barbara South County continues to evolve, with April 2026 data revealing specific shifts in pricing and inventory. Understanding these figures is essential for anyone navigating the local market, as the trends for single-family homes and condominiums show distinct paths. This analysis provides an overview of the current statistics to help clarify the state of the market.
Here is the SB MLS Statistics for April 2026: SBAOR Monthly MLS Statistics - April 2026
Where the Single-Family Market Stands This Spring
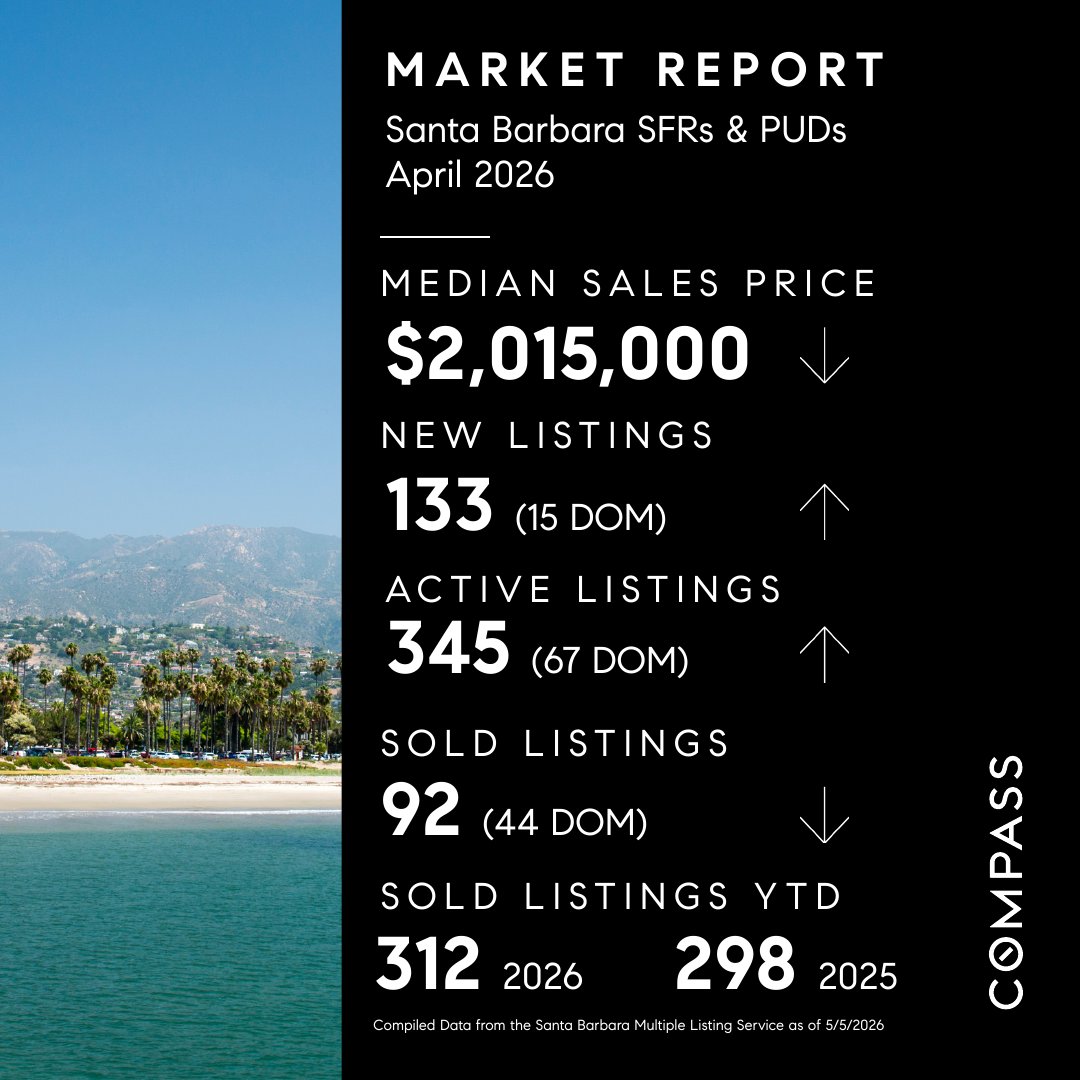
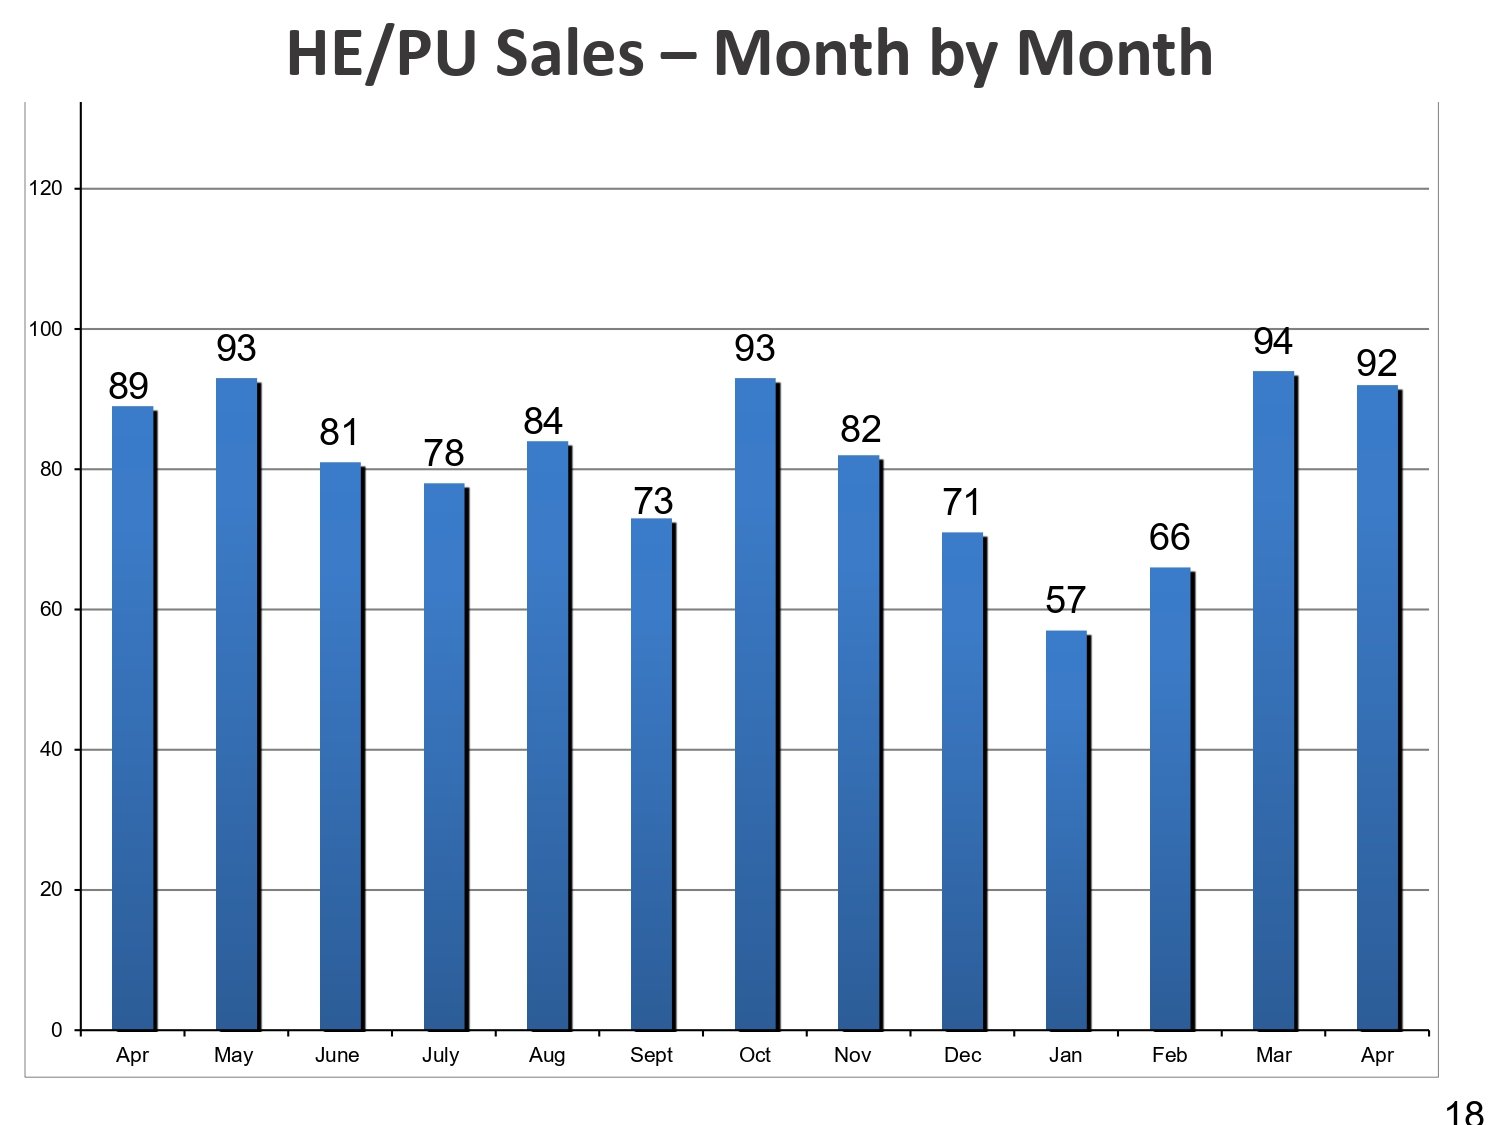
The single-family home sector, recorded 92 sold properties in April 2026. This figure represents a slight increase from the 89 sales recorded in April 2025. Year-to-date figures show 312 total sales for 2026, surpassing the 298 sales seen during the same period in 2025.
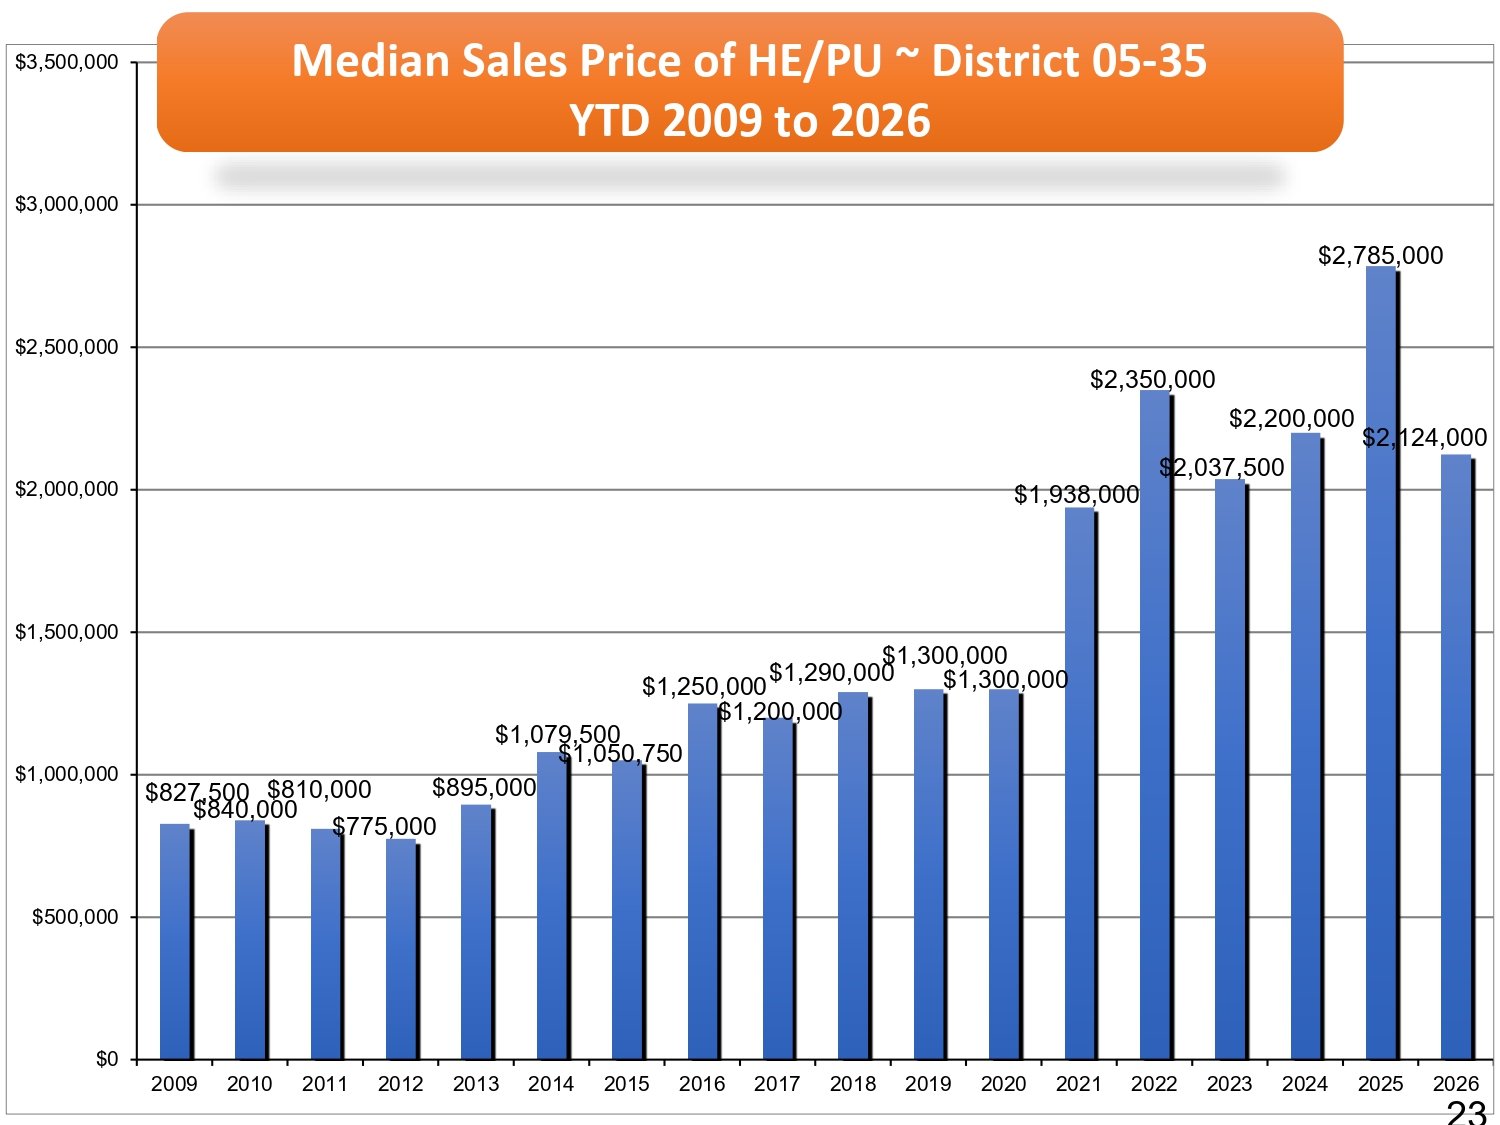
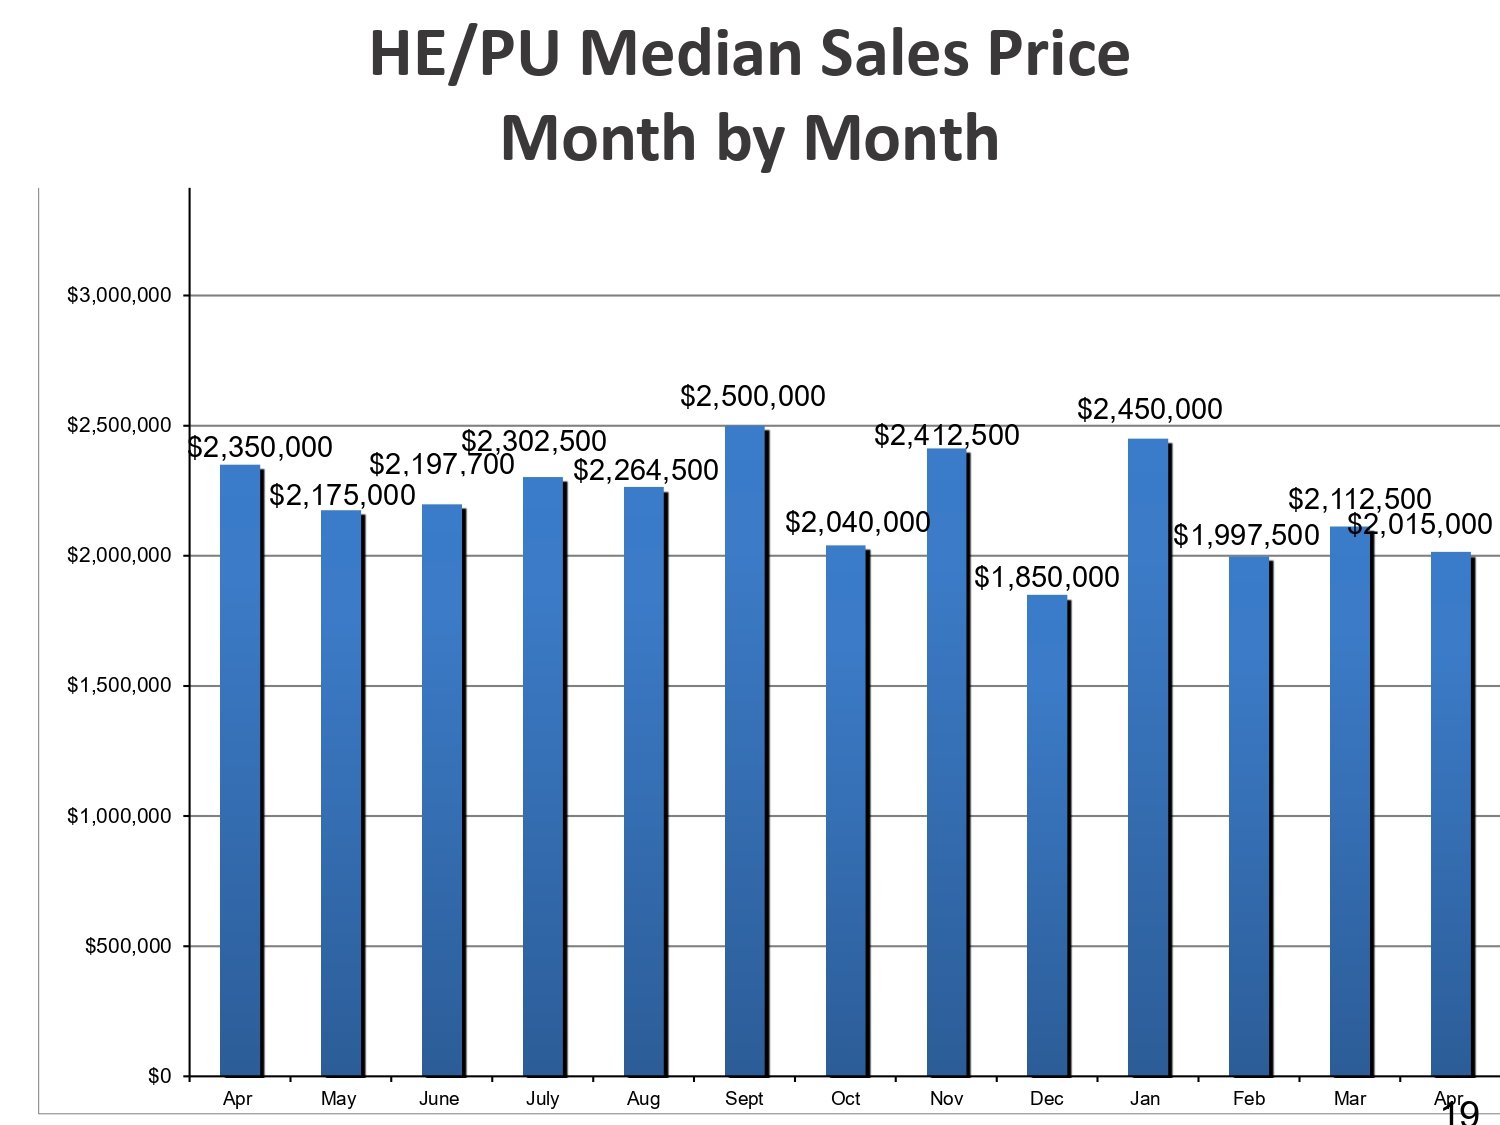
Pricing trends for homes exhibited a significant shift. The median sold price for April 2026 was $2,015,000. When comparing year-to-date data, the median sales price decreased by 3.5%, moving from $2,200,000 in 2025 to $2,124,000 in 2026. However, the average sold price year-to-date rose by 3.4%, reaching $3,616,593.
Inventory and market speed indicators include:
-
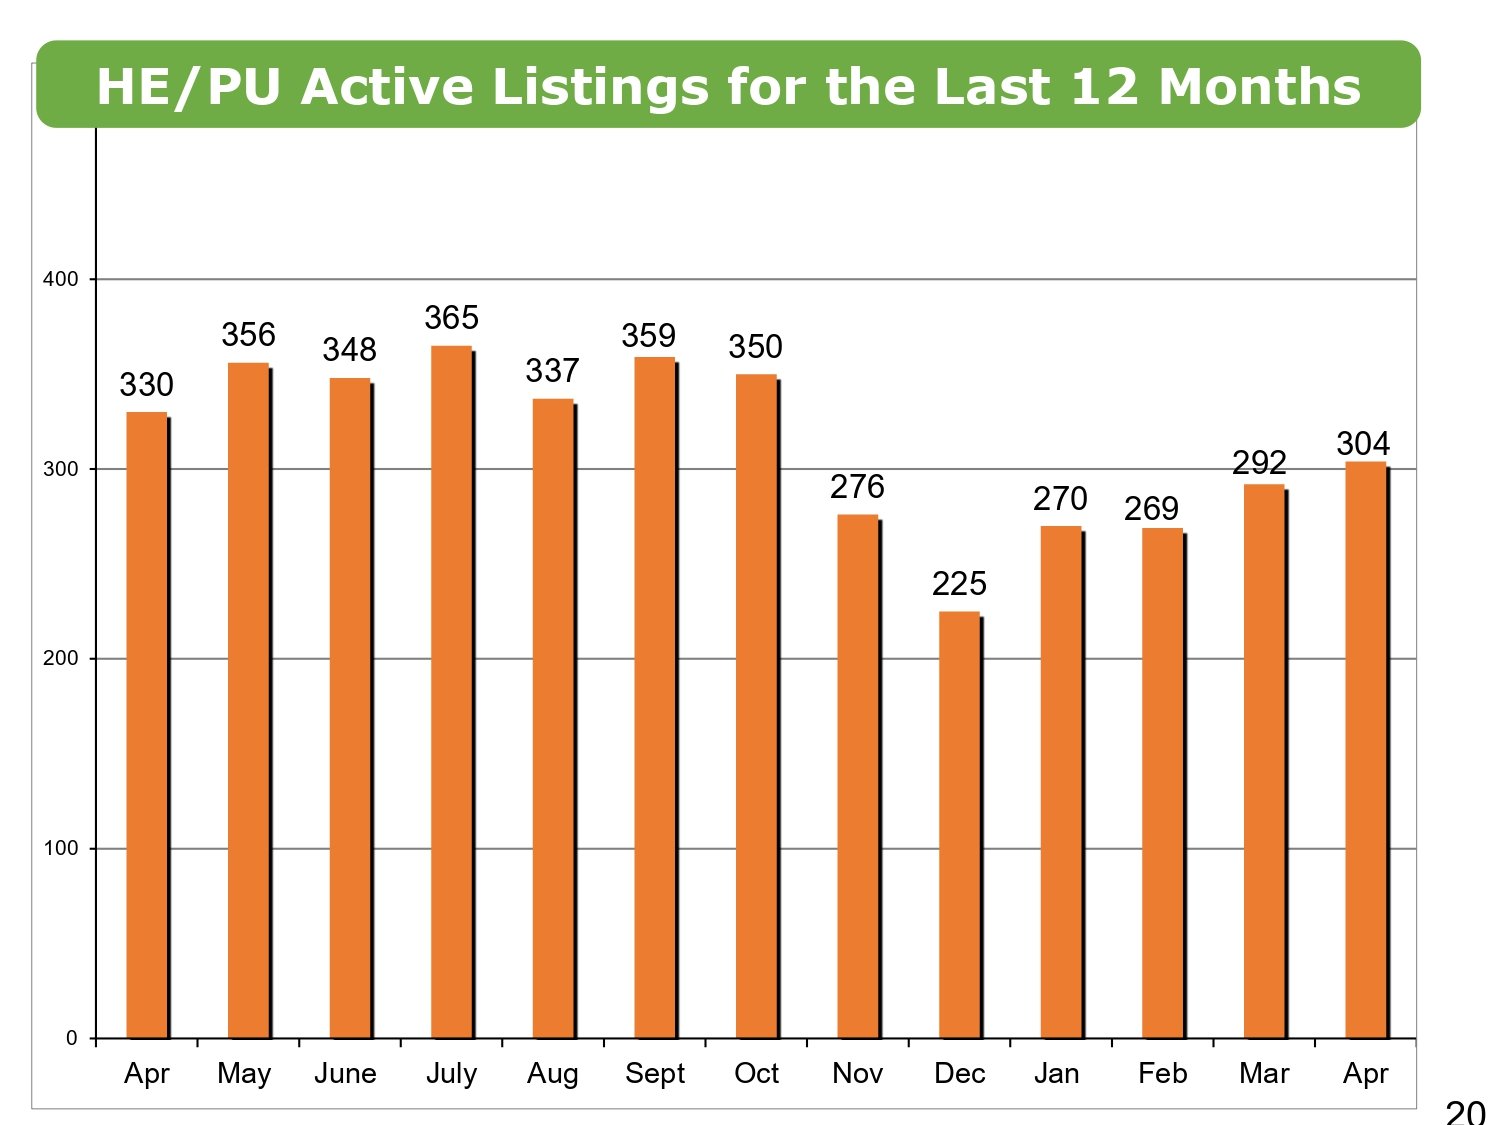
Active Listings: Total active listings remained stable with 559 properties in 2026 compared to 562 in 2025.
-
New Listings: Year-to-date new listings decreased by 6%, totaling 470 properties.
-
Market Time: The average market time for the 92 sold properties was 44 days.
-
Pending Sales: Properties entering escrow increased by 7.4% year-to-date, with 348 units compared to 324 in the previous year.
Condominiums Continue to Shift in Price and Pace
The condominium market experienced growth in sales activity but a decline in pricing metrics. April 2026 saw 31 closed sales, an increase from the 25 sales recorded in April 2025. Year-to-date condo sales rose 11.7%, reaching 115 units.
Price adjustments in the condo sector were more pronounced than in the home sector:
-
Median Sales Price: The April 2026 median price was $955,000. Year-to-date, the median sales price fell 13.2% to $1,020,000 from $1,175,000 in 2025.
-
Average Sold Price: The year-to-date average price decreased 14.7% to $1,237,971.
-
Sold Volume: Total sold volume for the year-to-date period reached $142,366,665, a 4.7% decrease from the prior year.
Condominiums moved faster than single-family homes, with an average market time of 25 days. Supply levels retracted slightly as total active listings fell 4% and new listings decreased 5.6% year-to-date.
Market Implications for Buyers and Sellers
The April 2026 data indicate a complex environment for participants in the Santa Barbara South County market. Understanding these specific shifts is essential for navigating current real estate transactions.
What Buyers Are Navigating Right Now
Buyers in the single-family home sector face a market where the average sales price is increasing despite a slight dip in the median price. The year-to-date median price of $2,124,000 suggests a potential softening in the middle market, which may provide more leverage during negotiations. However, the 6% decrease in new listings indicates that inventory remains tight. For those seeking condominiums, the 13.2% year-to-date decrease in median sales price offers a more accessible entry point compared to previous years. Buyers should remain prepared for swift action, as condominiums are moving in an average of 25 days.
How Sellers Are Positioning in Today’s Market
Sellers of high-end estates continue to see strong performance, evidenced by the 3.4% rise in average sales price and significant volume in the $5,000,000 and above category. The stability in active listings suggests that while competition is not increasing rapidly, pricing remains critical to avoid extended market time. Sellers in the condominium market should note the increase in sales volume, which indicates high demand, even as price points adjust.
Inventory Holds Steady as Buyer Activity Continues
The 7.4% increase in pending sales shows a consistent flow of transactions, confirming that buyer demand remains resilient. For all parties, the average market time of 44 days for homes provides a benchmark for realistic timing expectations. The data reflects a market that rewards precision in pricing and a thorough understanding of localized district trends.
Santa Barbara South County Home Estates, and PUD Active Listings for the Last 12 Months
Santa Barbara South County Number of Homes, Estates, and PUDs Sales Year-to-Date 2009 to 2026
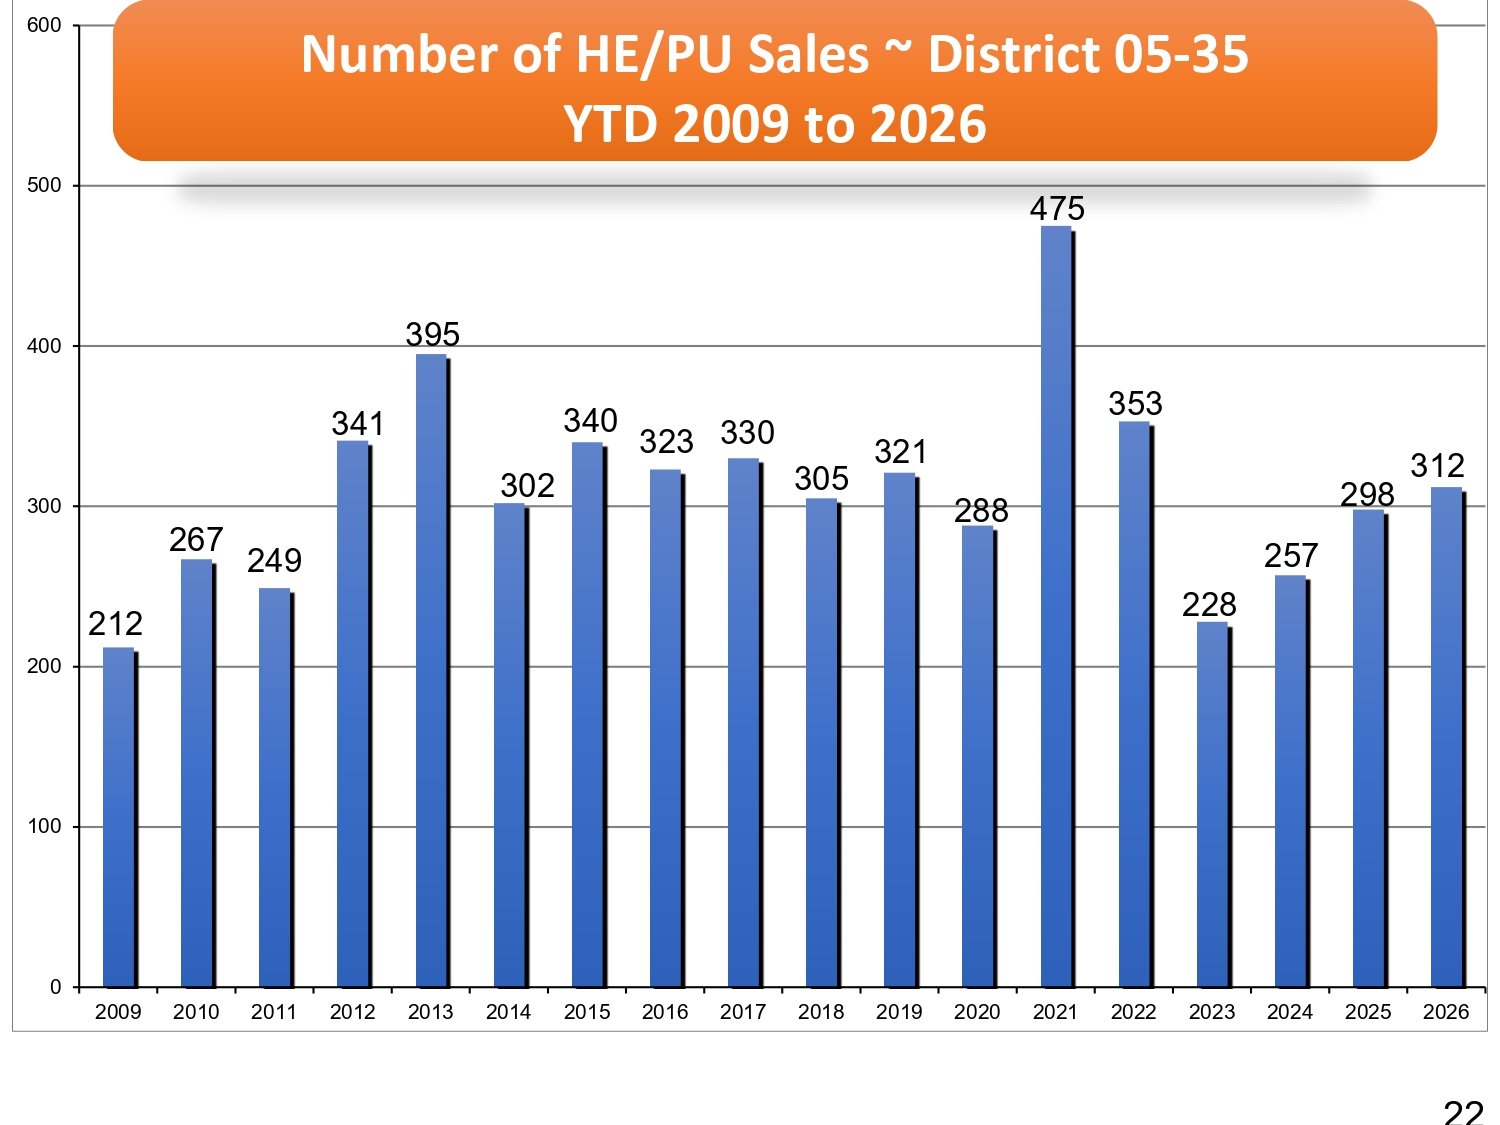
Santa Barbara South County Homes, Estates, and PUD Sales - Year-to-Date 2009 to 2026
Santa Barbara South County Homes, Estates, and PUD Sales - Month by Month
Santa Barbara South County Home, Estates, and PUD Median Sales Price - Month by Month
Achieve Your Real Estate Goals with Locale Group
Success in the Santa Barbara South County real estate market depends on a strategic approach backed by the latest April 2026 data. Those looking to capitalize on the recent 13.2% year-to-date decrease in the median sales price for condominiums, or sellers aiming to position a luxury estate in a sector where the average sales price has risen 3.4%, will find that Locale Group provides the professional guidance necessary to achieve these objectives.
Our team specializes in interpreting complex market statistics to create actionable plans, helping clients move forward with confidence despite a 6% decrease in new single-family listings. Contact Locale Group today for a personalized consultation to ensure your next real estate move is informed and efficient.
Connect with the Locale Group today!
M: (805) 284-3660
E: [email protected]