Santa Barbara South County MLS Statistics For April 2025
Real Estate Market Update
Here are the SB MLS Statistics for April 2025: https://sbaor.org/clientuploads/2025/Stats/April_2025_stats.pdf
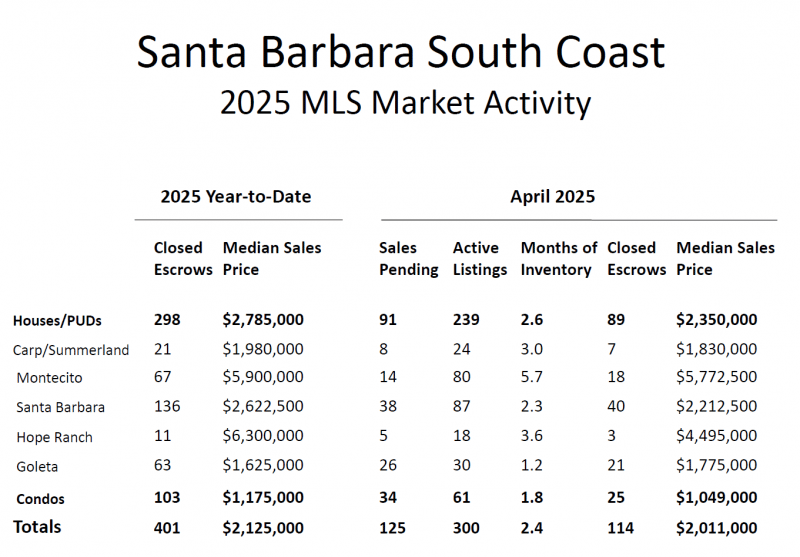
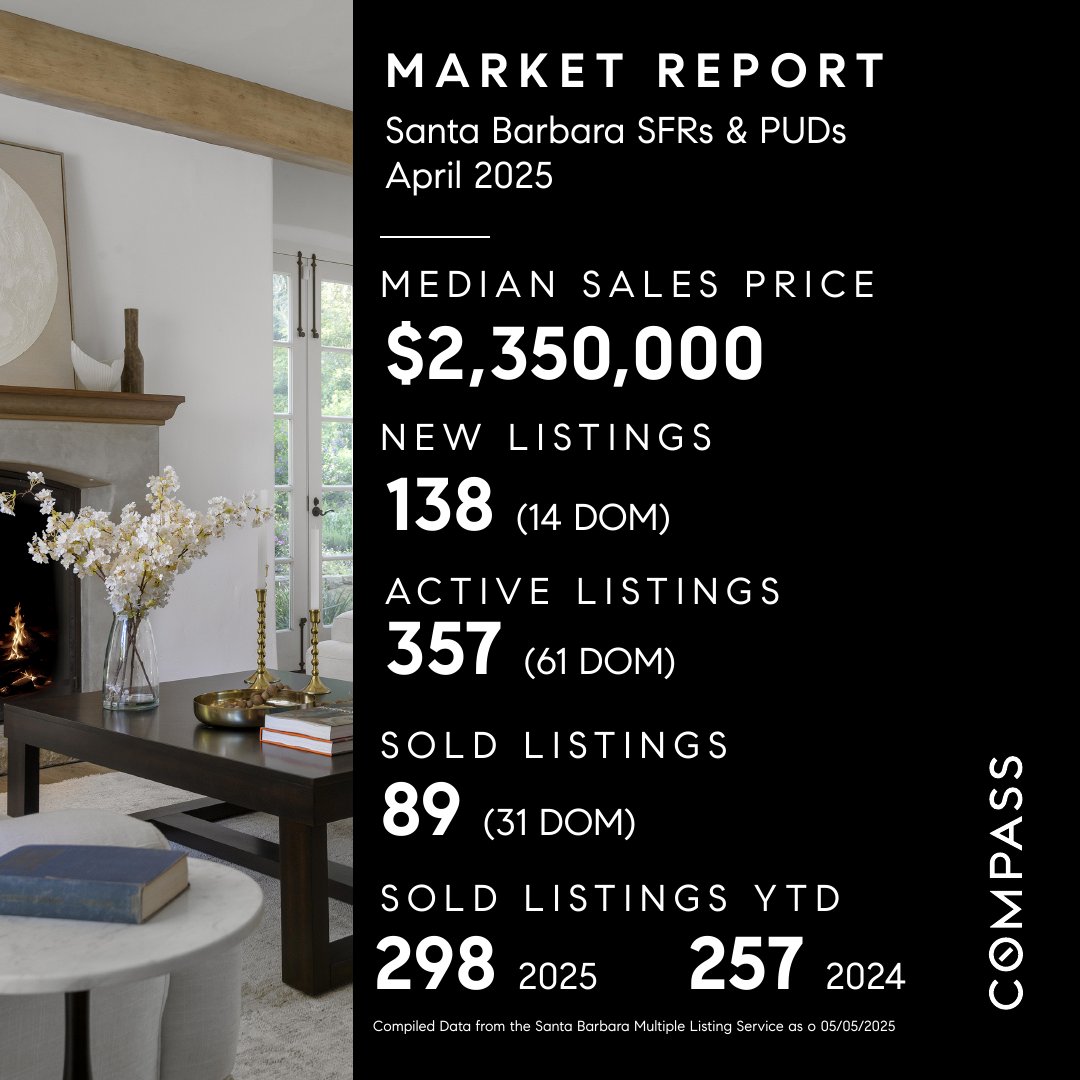
April 2025 Market Snapshot: Santa Barbara South County
The real estate market in Santa Barbara continues to show strong momentum. Home and PUD sales reached $283.4M across 89 transactions, with a median sales price of $2.35M—up from last year. Inventory is also climbing, with 24% more active listings and new listings year-over-year. While the average days on market ticked up slightly, homes still sold at 97.6% of list price on average.
Luxury continues to lead the way, with 16 homes selling above $5M and overall sold volume for the year topping $1.1B. Condos also performed well, with a median price just over $1M. As demand remains steady and inventory builds, we may see more opportunities emerging in the months ahead.
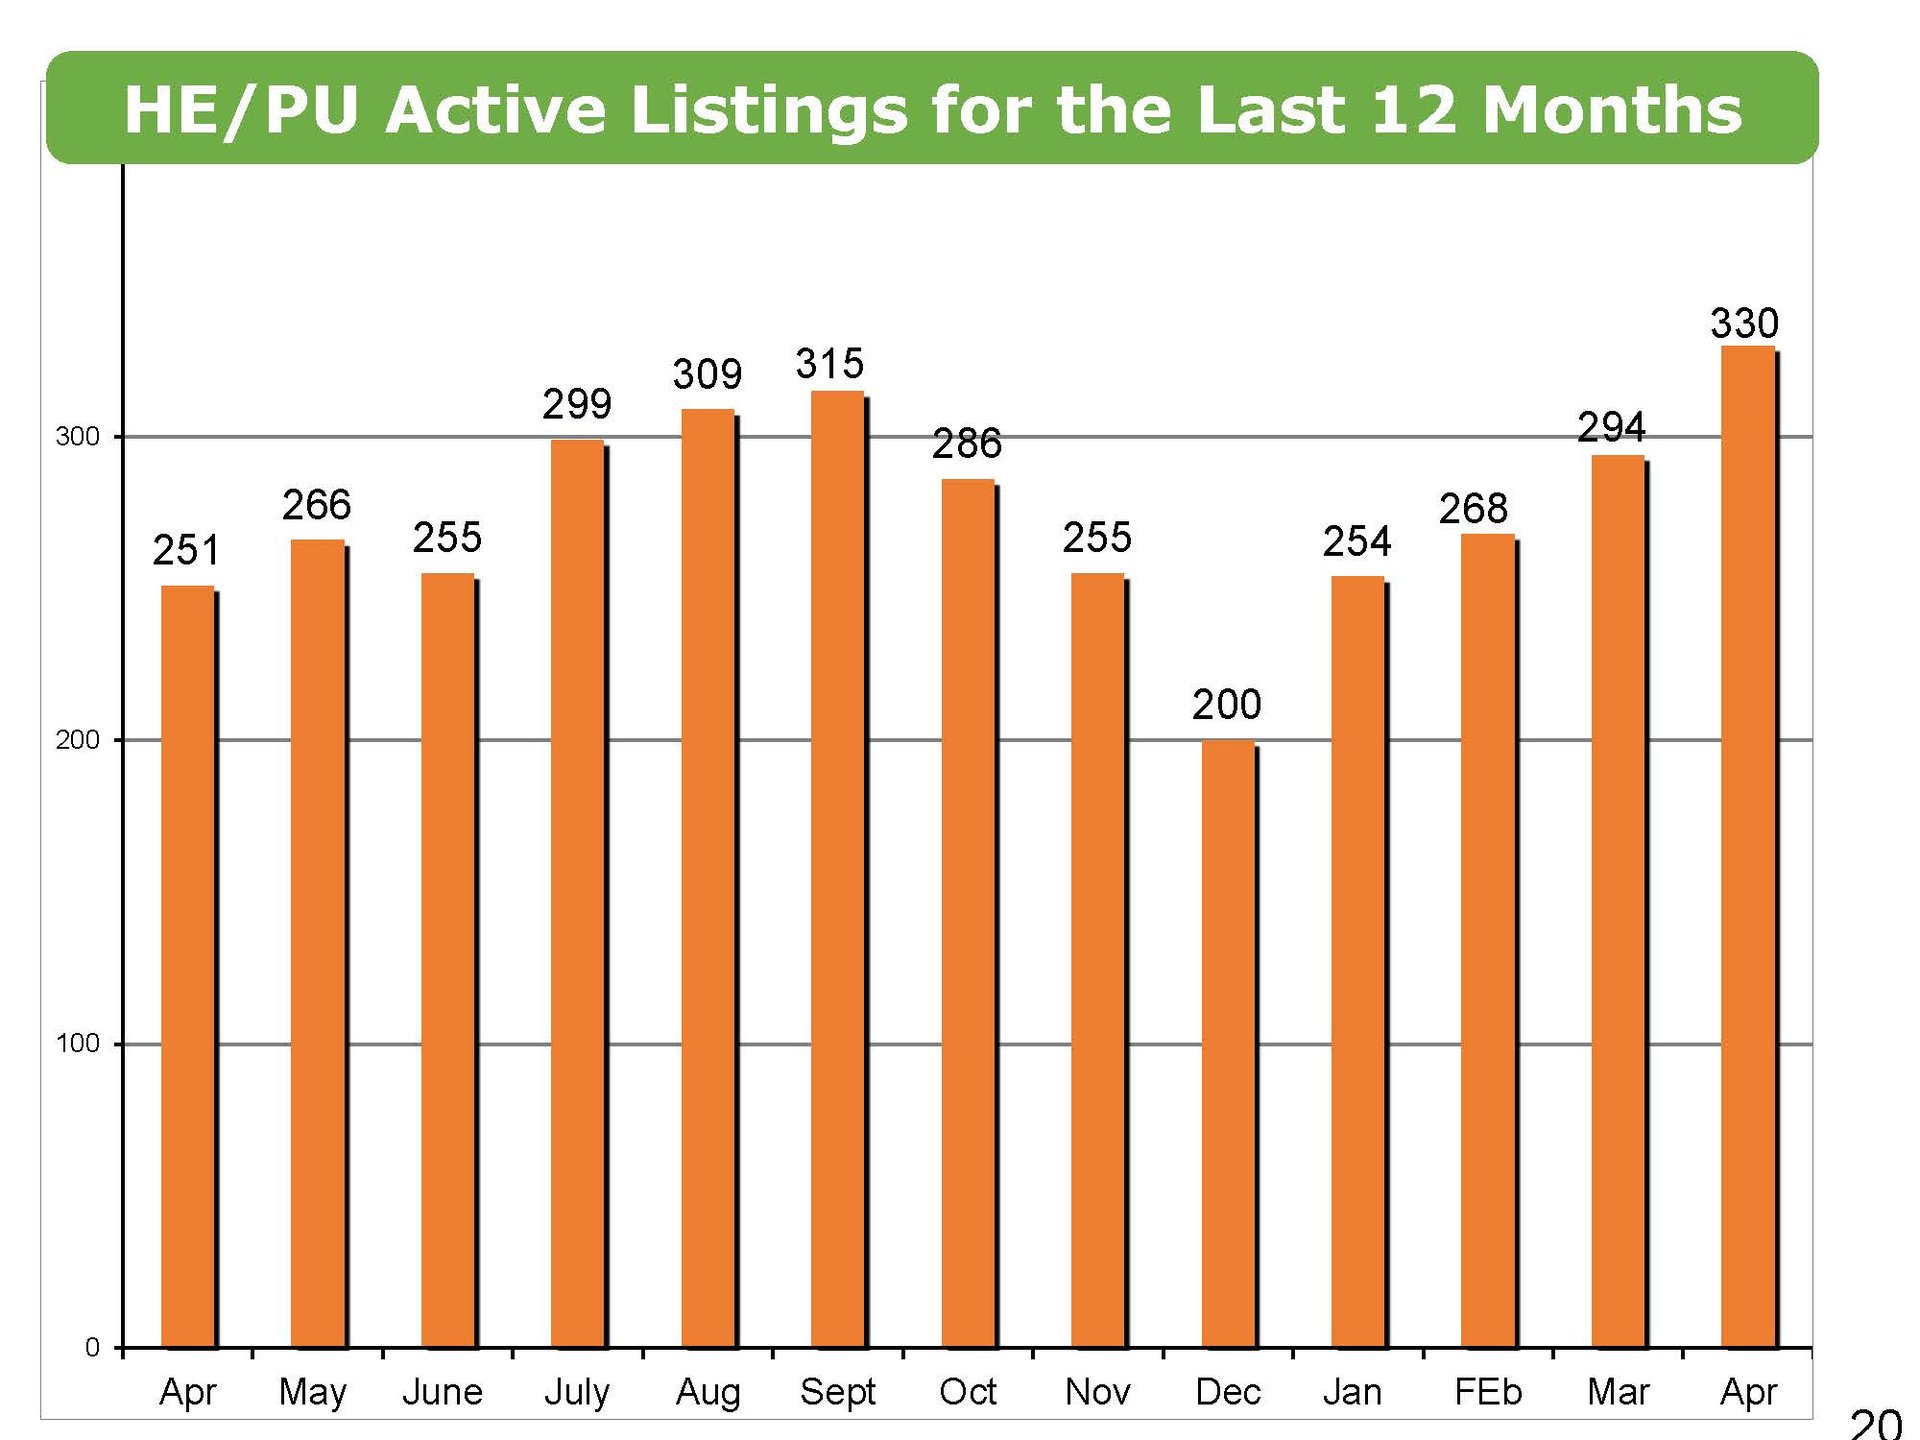
Santa Barbara South County Active Listings for the Last 12 Months
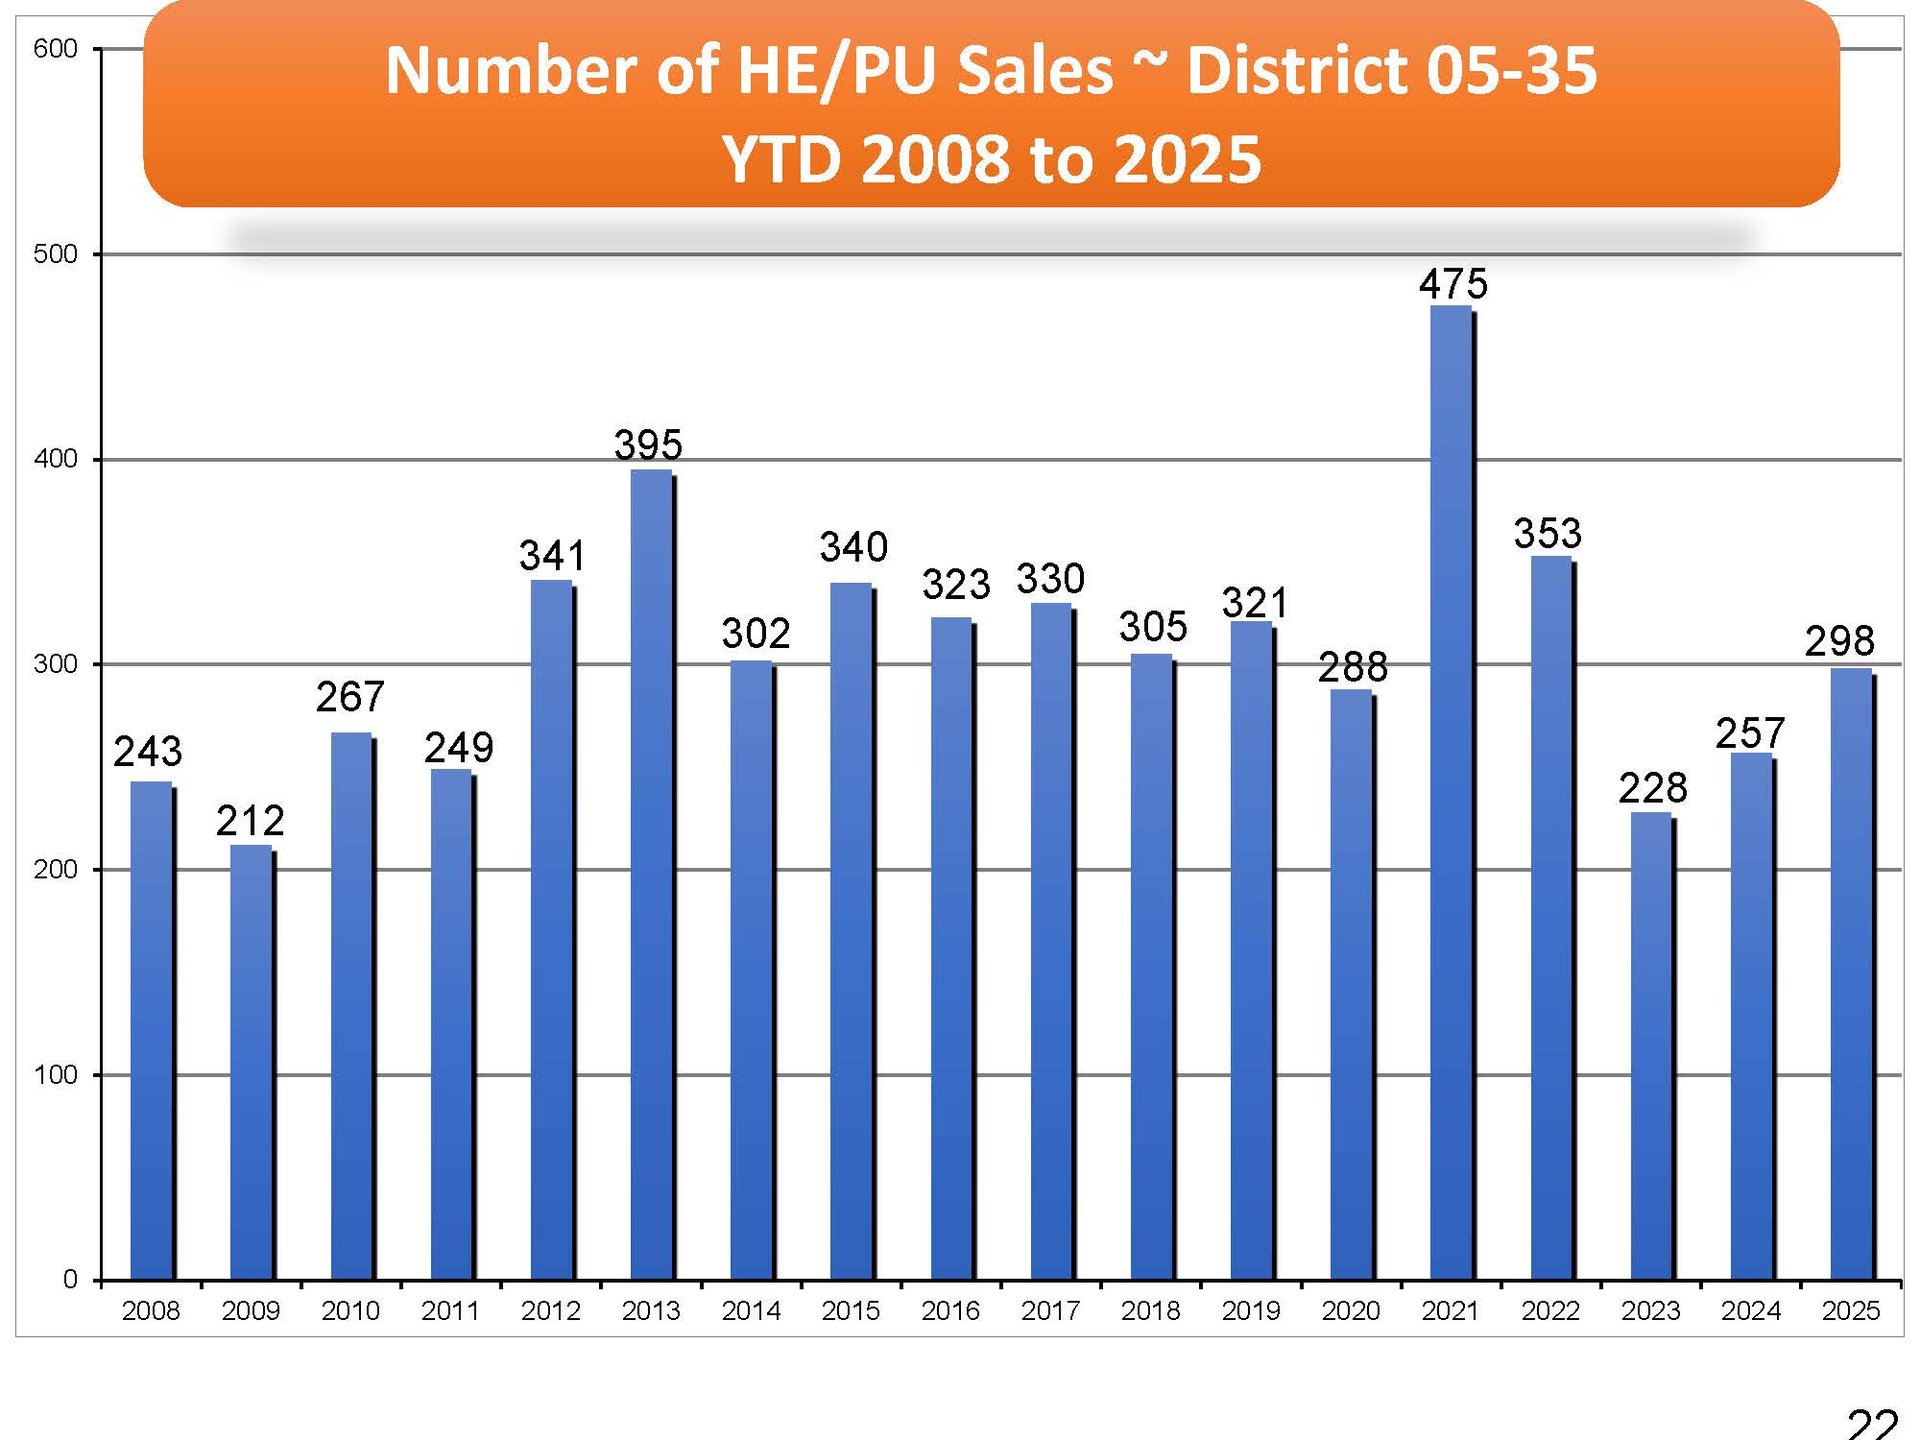
Santa Barbara South County Number of Homes, Estates, and PUDs Sales Year-to-Date 2008 to 2025
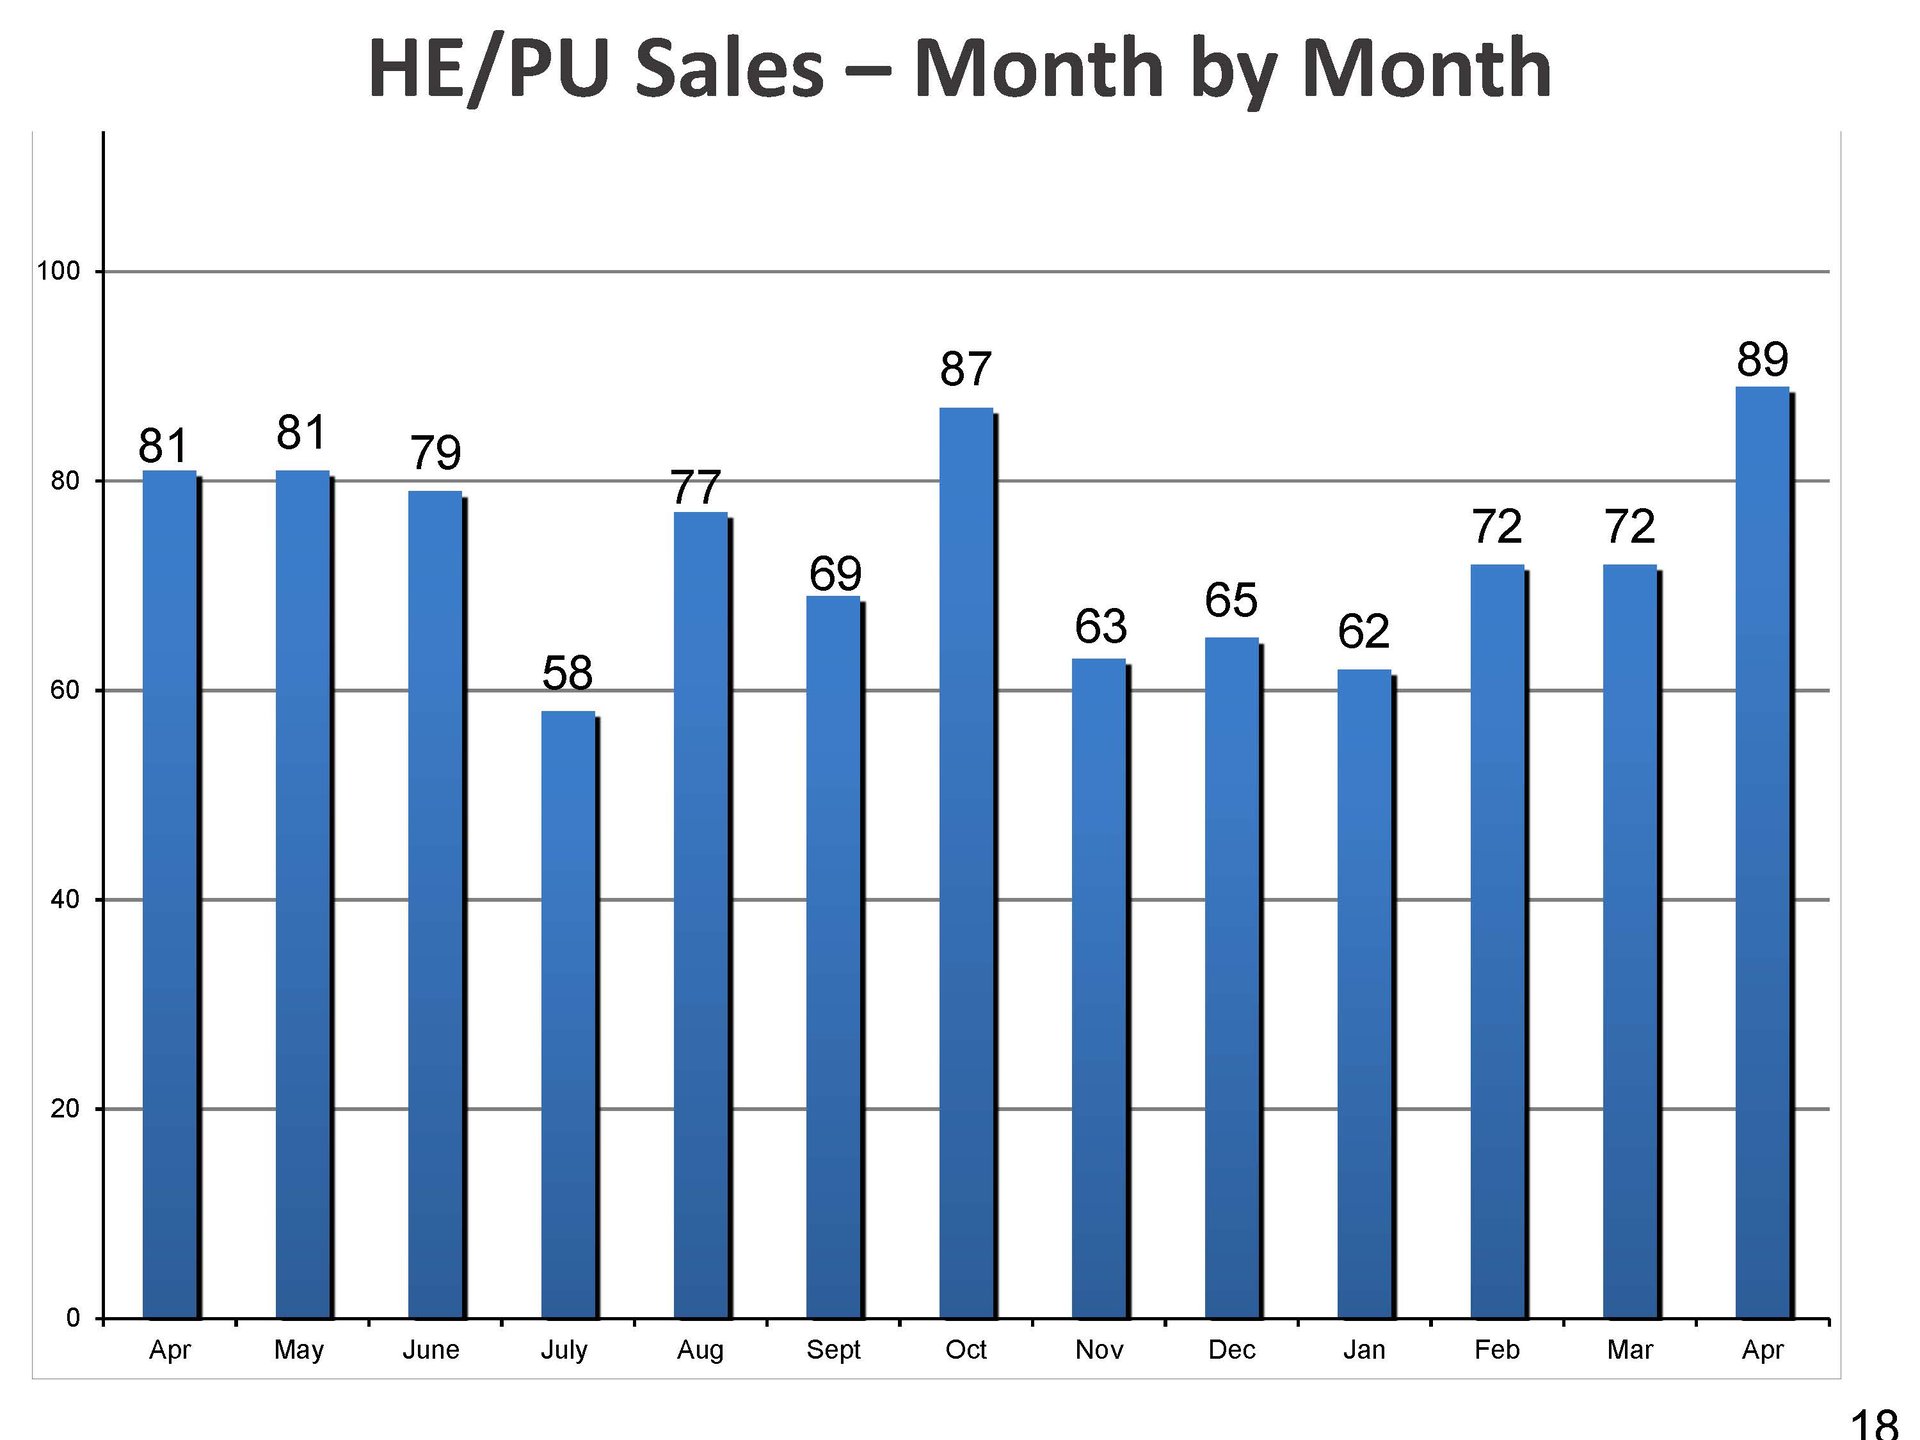
Santa Barbara South County Homes, Estates, and PUD Sales - Month by Month
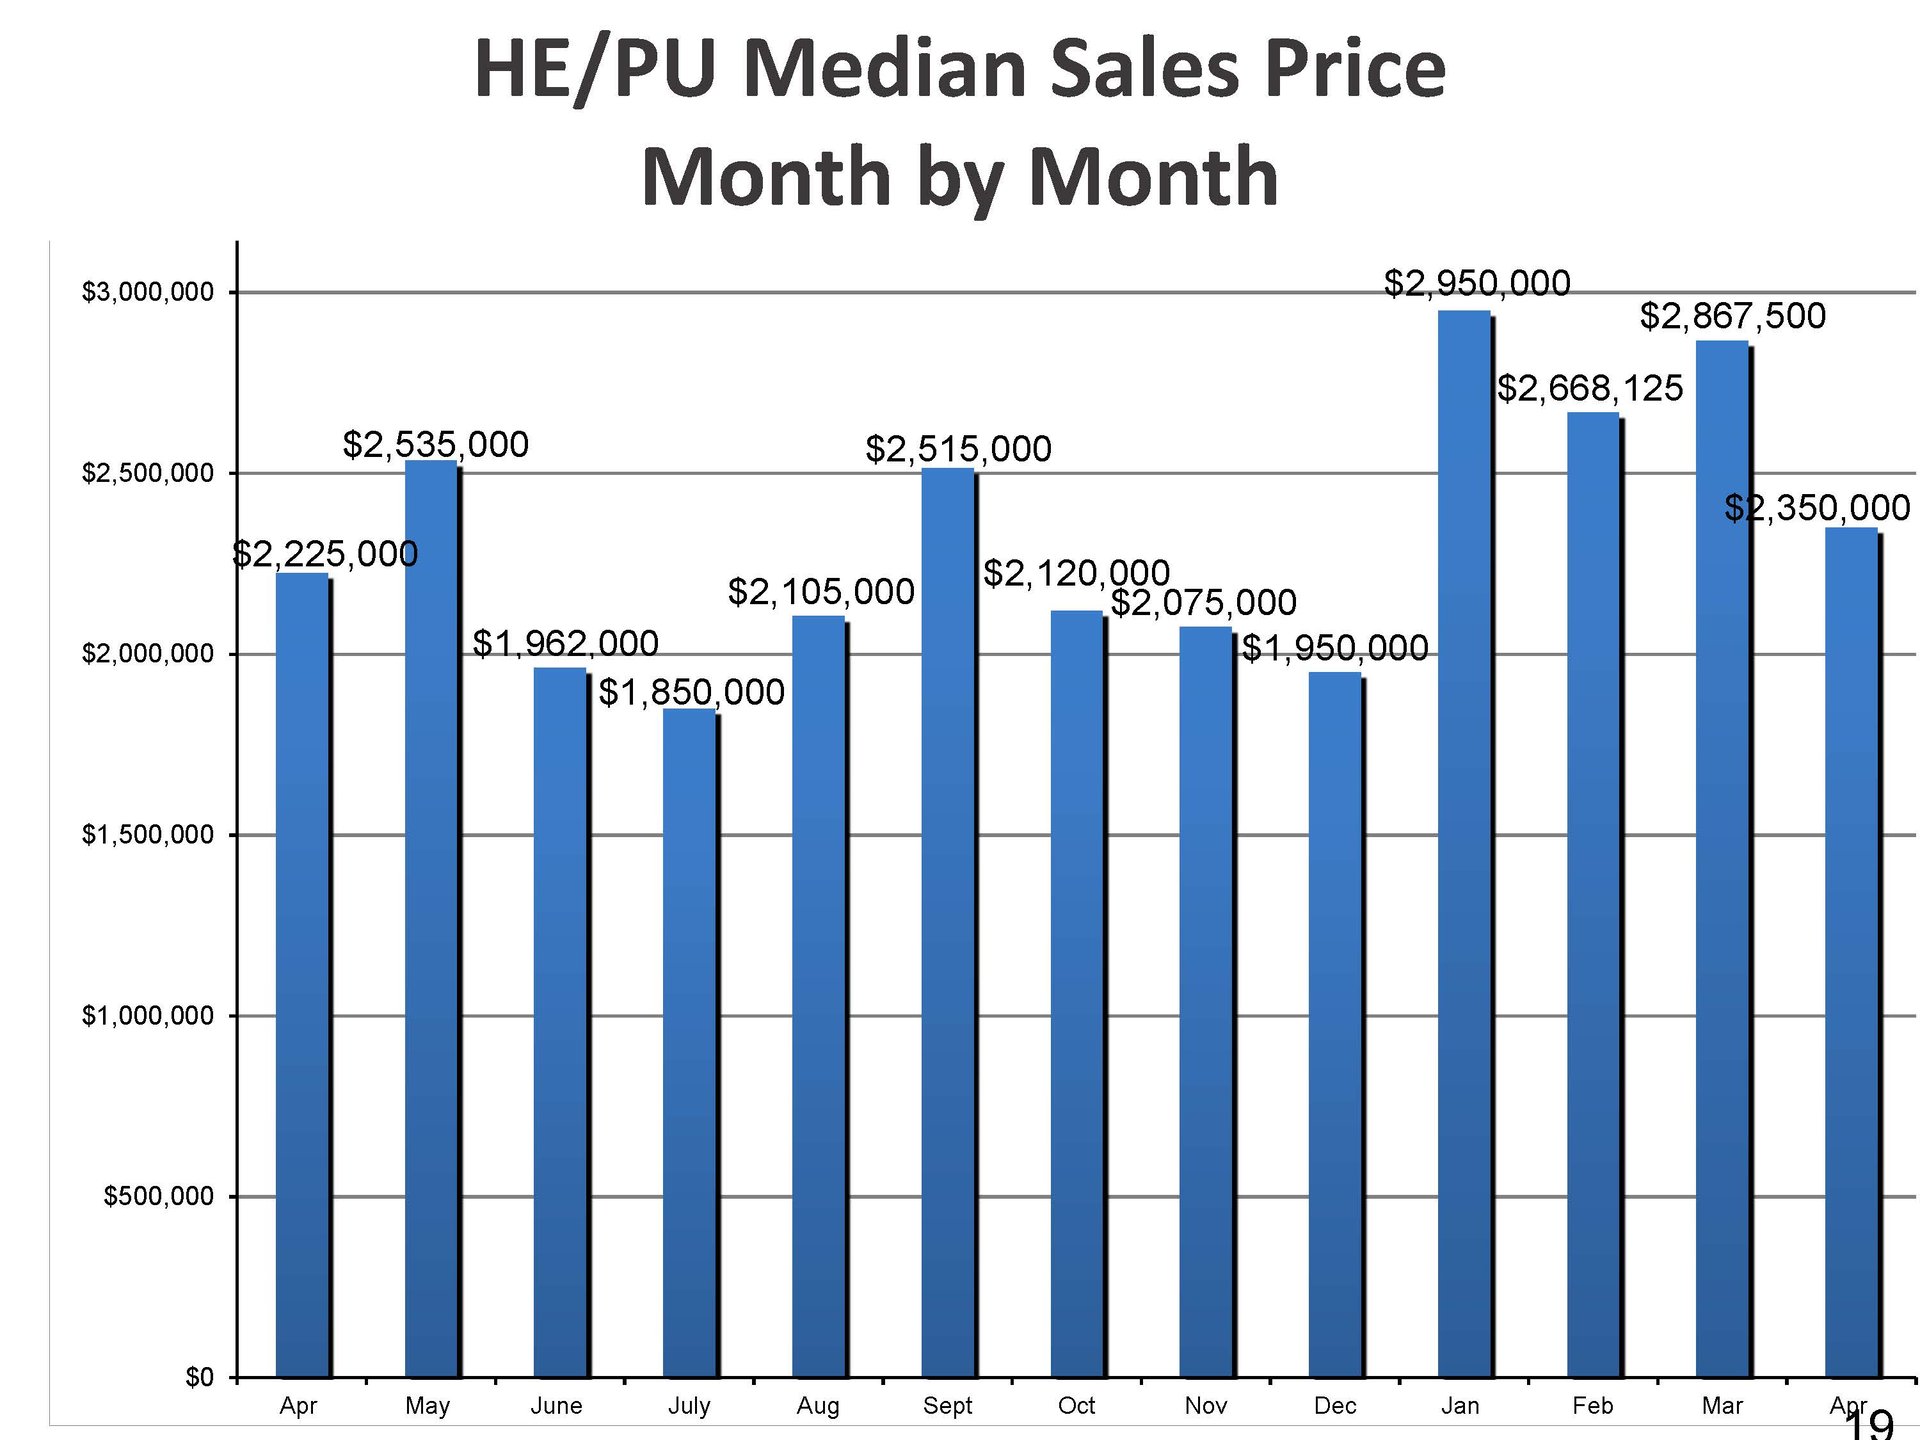
Santa Barbara South County Home, Estates, and PUD Median Sales Price - Month by Month
Contact us to receive a link to the in-depth Fidelity Title Report Santa Barbara, Montecito & Hope Ranch monthly and year-to-date statistics.
Call, text or email today!
(805) 284-3660
[email protected]