
November 2025 National Real Estate Insights
with market data through October*
Compared to 1 year ago, the U.S. median house sales price in October 2025, at $420,600, rose 2.2%, while the median condo/co-op price, at $363,700, increased .9%. Existing-home sales rose almost 1% from September and about 3% from October 2024. The number of active listings was essentially flat month over month, but 11% higher year over year. Months-supply-of-inventory ticked down for the second month, indicating a gradual improvement in buyer demand as compared to the supply of listings for sale. Approximately 19% of home sales sold above asking price, and the median time on market was 34 days, up 5 days from October 2024. Cash purchases accounted for 29% of transactions; 32% went to first-time buyers; and 2% were distressed sales (foreclosure or short sales). Price reductions were well down from the peak in June, but 20% higher year over year, and over the past 3 months, 7% of contracts were cancelled before close of escrow, up from 5% during the same period last year.
Access the full National Real Estate Market Insights report for November 2025 [here]

The 30-year mortgage rate hit a 12+ month low in late October and then increased slightly through the 3rd week of November. In its last reading, inflation ticked up slightly to 3%, and the Fed made its second 2025 quarter-point benchmark-rate reduction while cautioning that another decrease in December was not certain. Amid substantial and vehement analyst disagreement regarding a possible AI bubble, the S&P 500 and Nasdaq stock market indices have seen considerable volatility and dropped 5-6% in the 3 weeks since peaking on 10/29/25. The consumer confidence reading in early November fell close to a 45-year low, with ongoing concerns regarding prices, personal finances, inflation and job security, though sentiment among affluent households was running significantly higher due to stock market gains. Cryptocurrency values fell more than 25% in the last 6 weeks.
The number of new listings coming on market typically hits its nadir in December with a commensurate fall in sales activity.
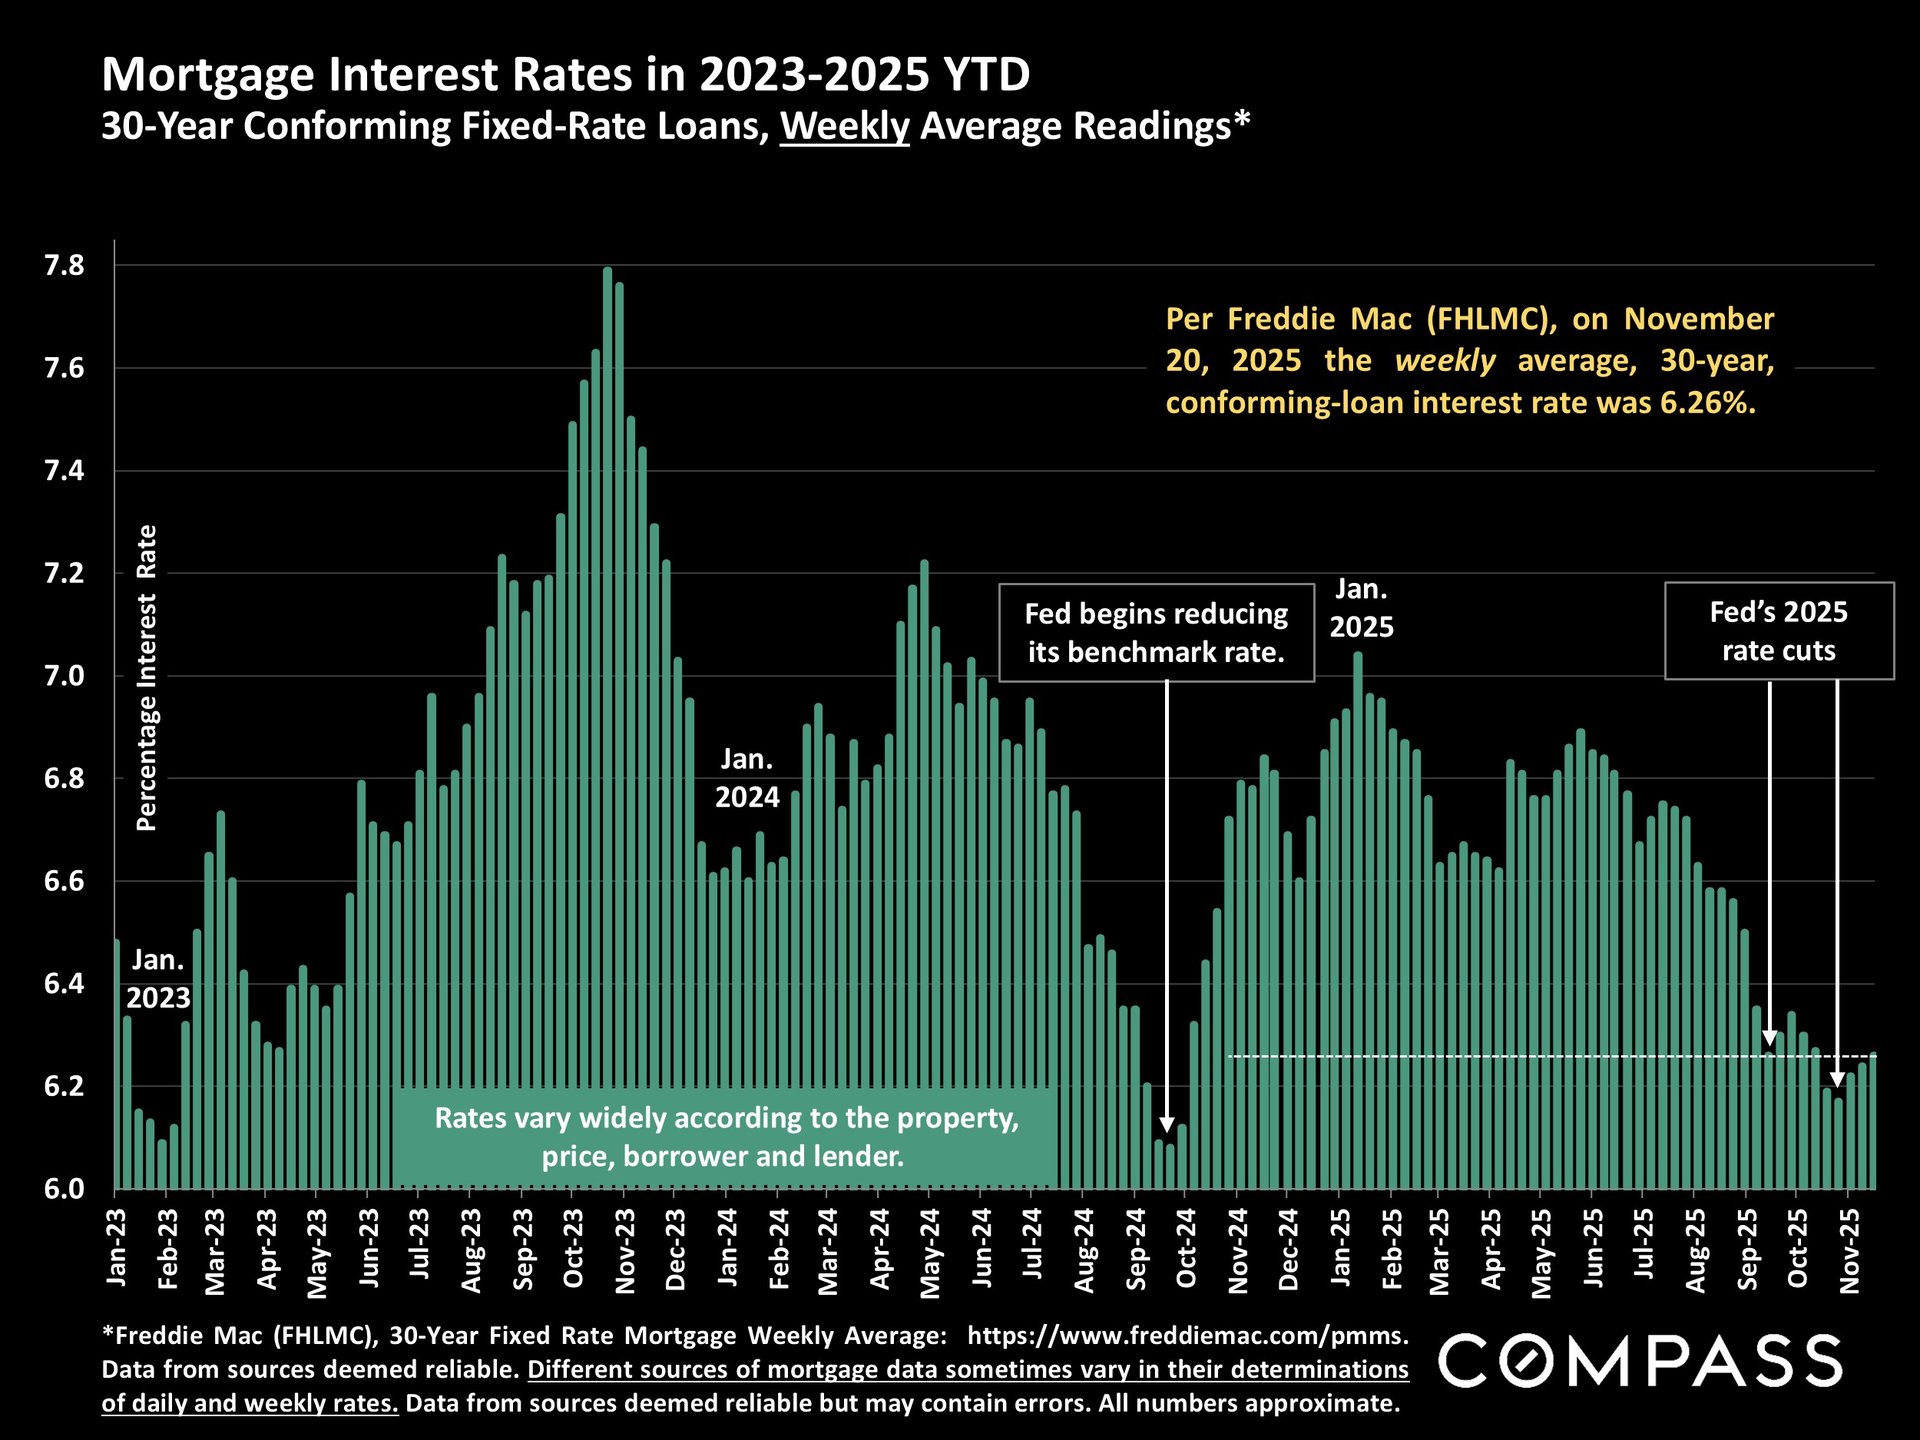
Interest rates have increased slightly since the end of October, but remain close to the lowest readings in the past 3 years.
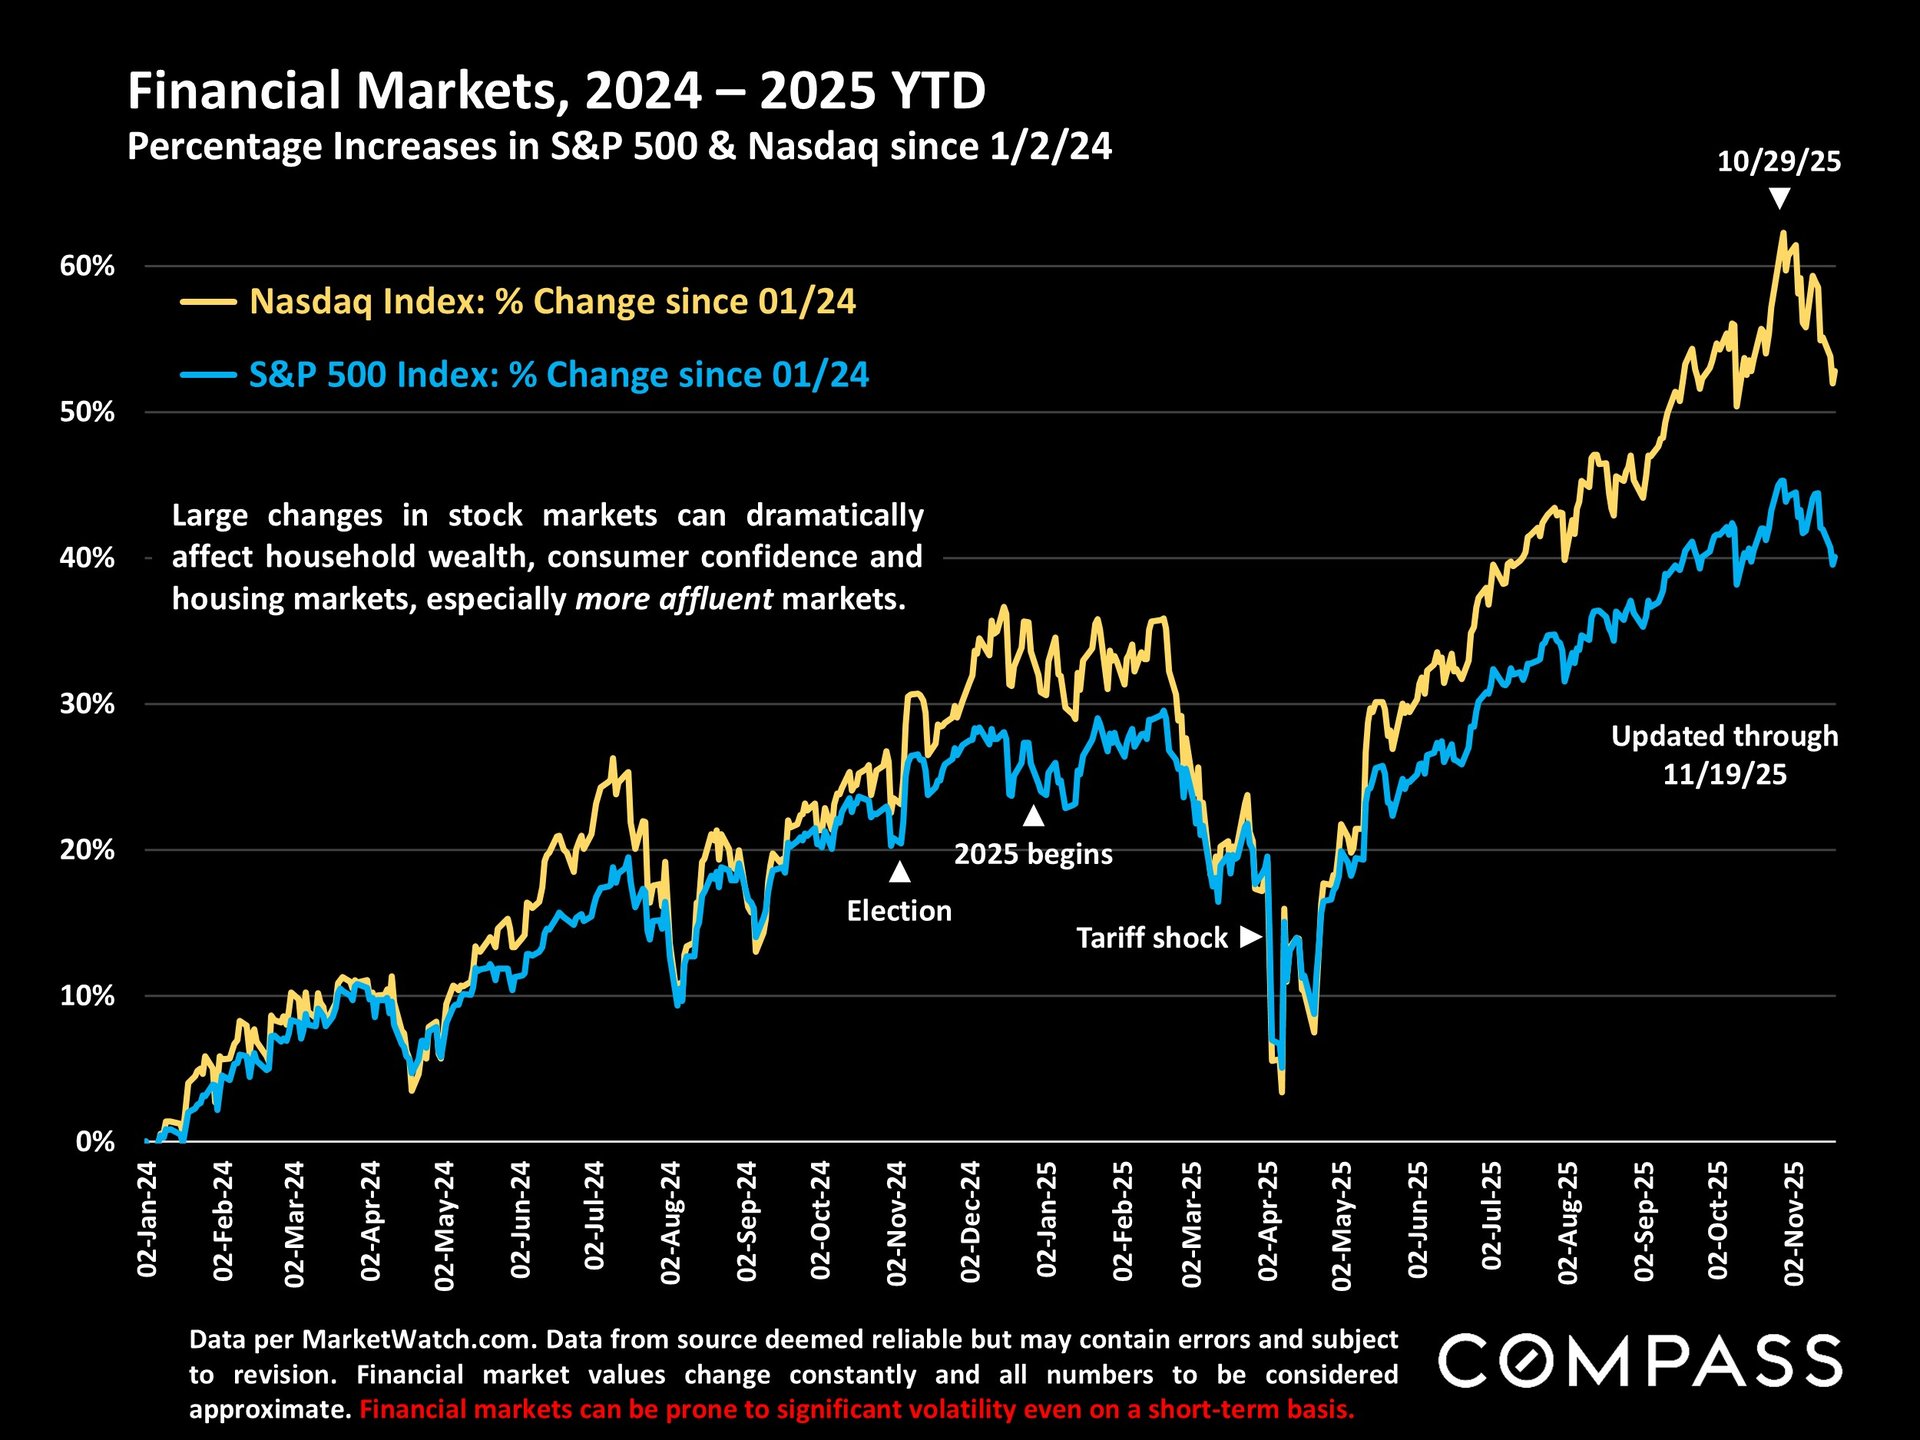
Stock markets have experienced substantial volatility since their peaks in late October.

The National Association of Realtors just published its annual report on buyers and sellers, and clicking on the image above will take you to our review of its highlights. There is some very interesting data in the report.
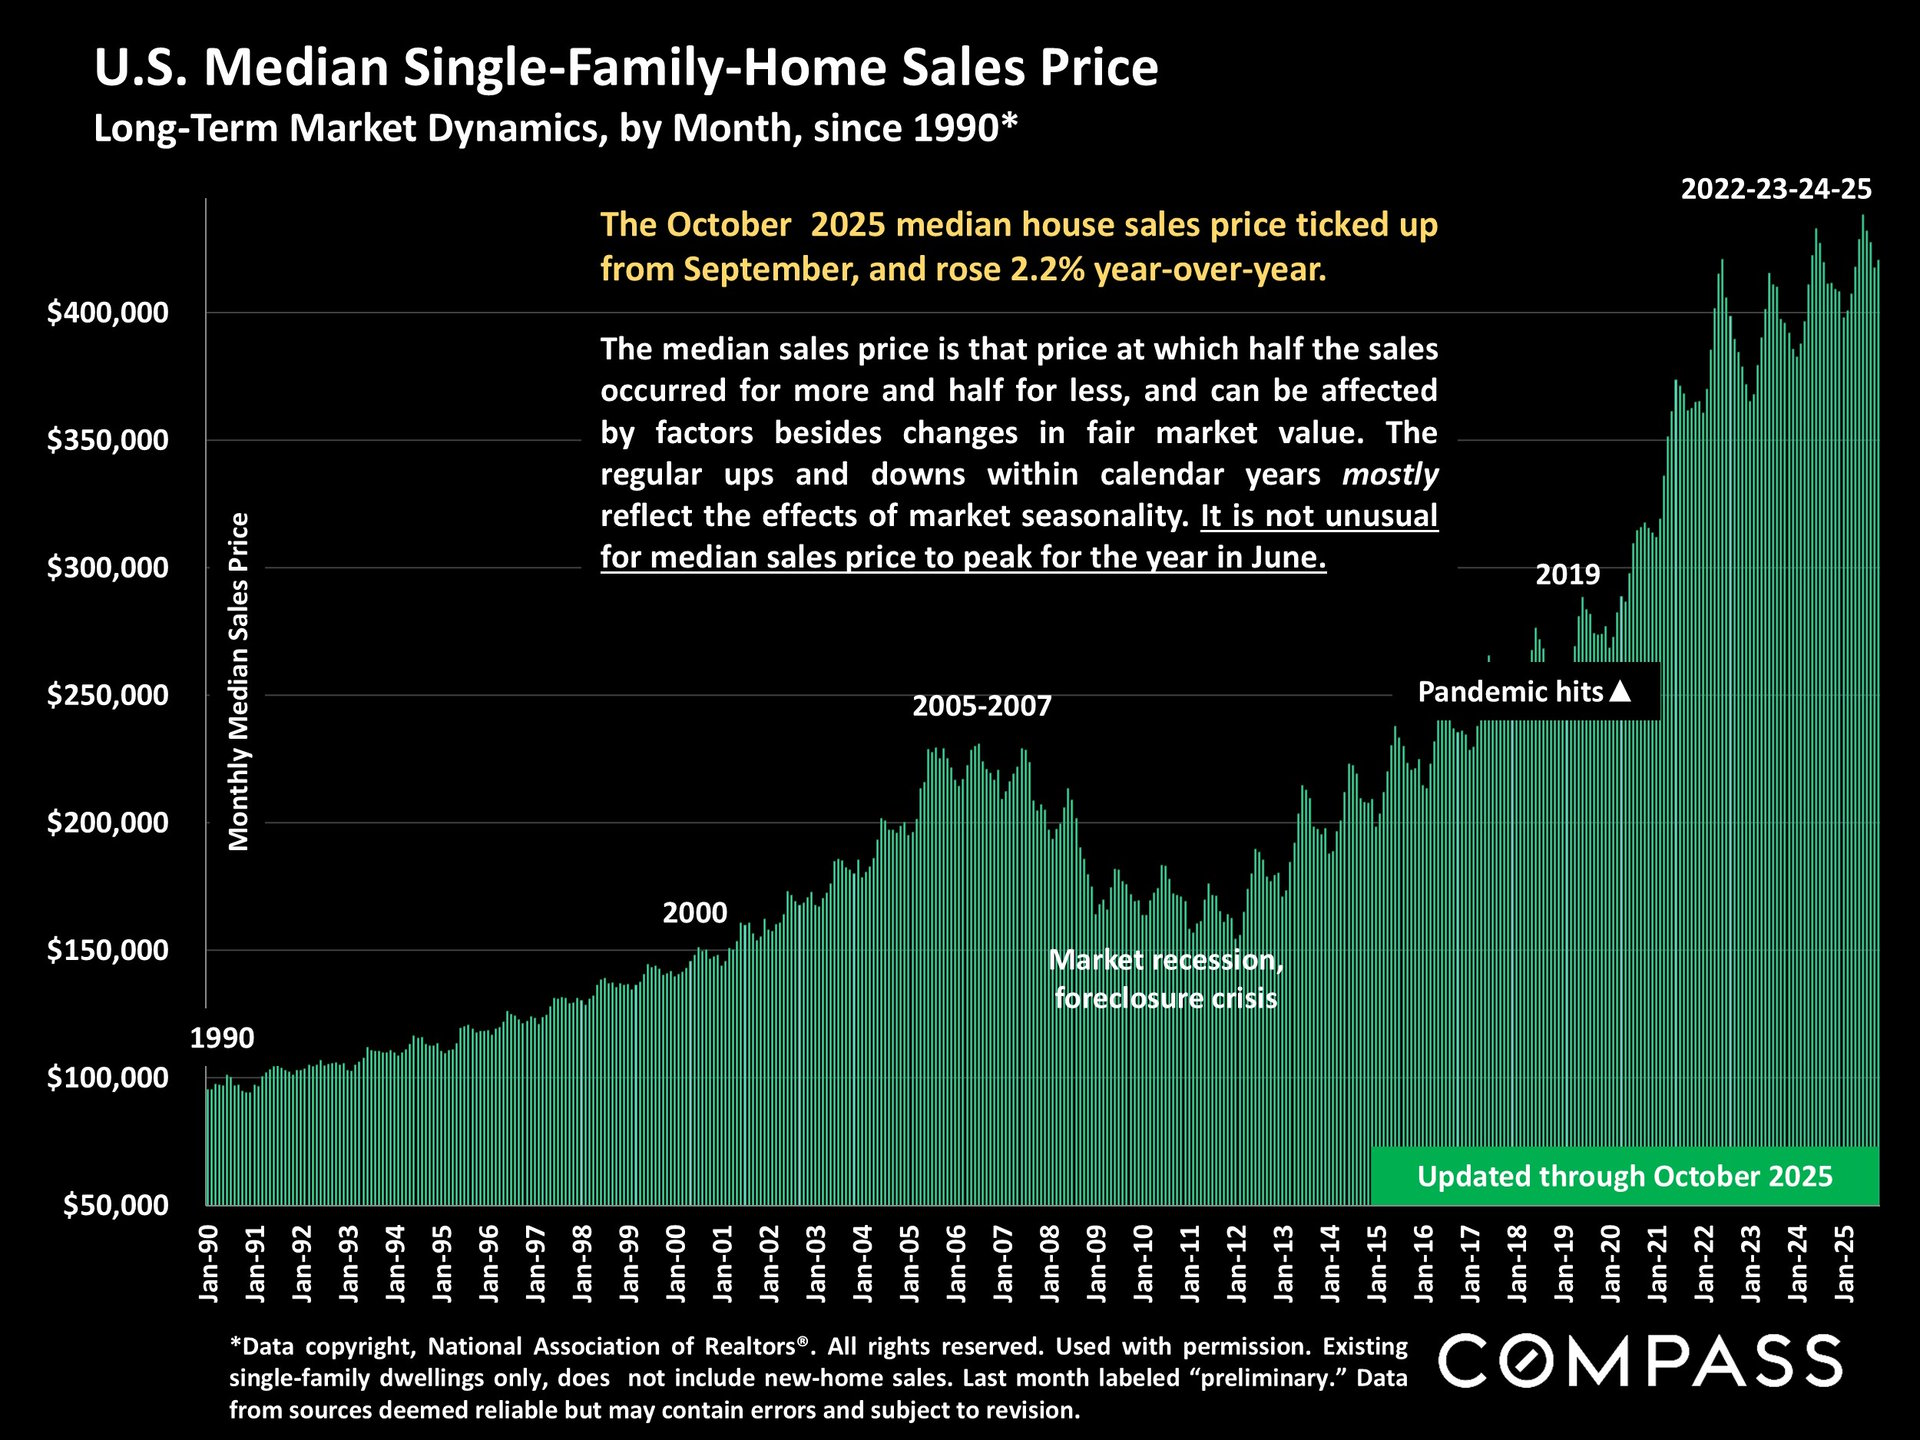
The next 5 slides look at national, metro-area and regional home prices. The first illustrates national median house sales prices since 1990.
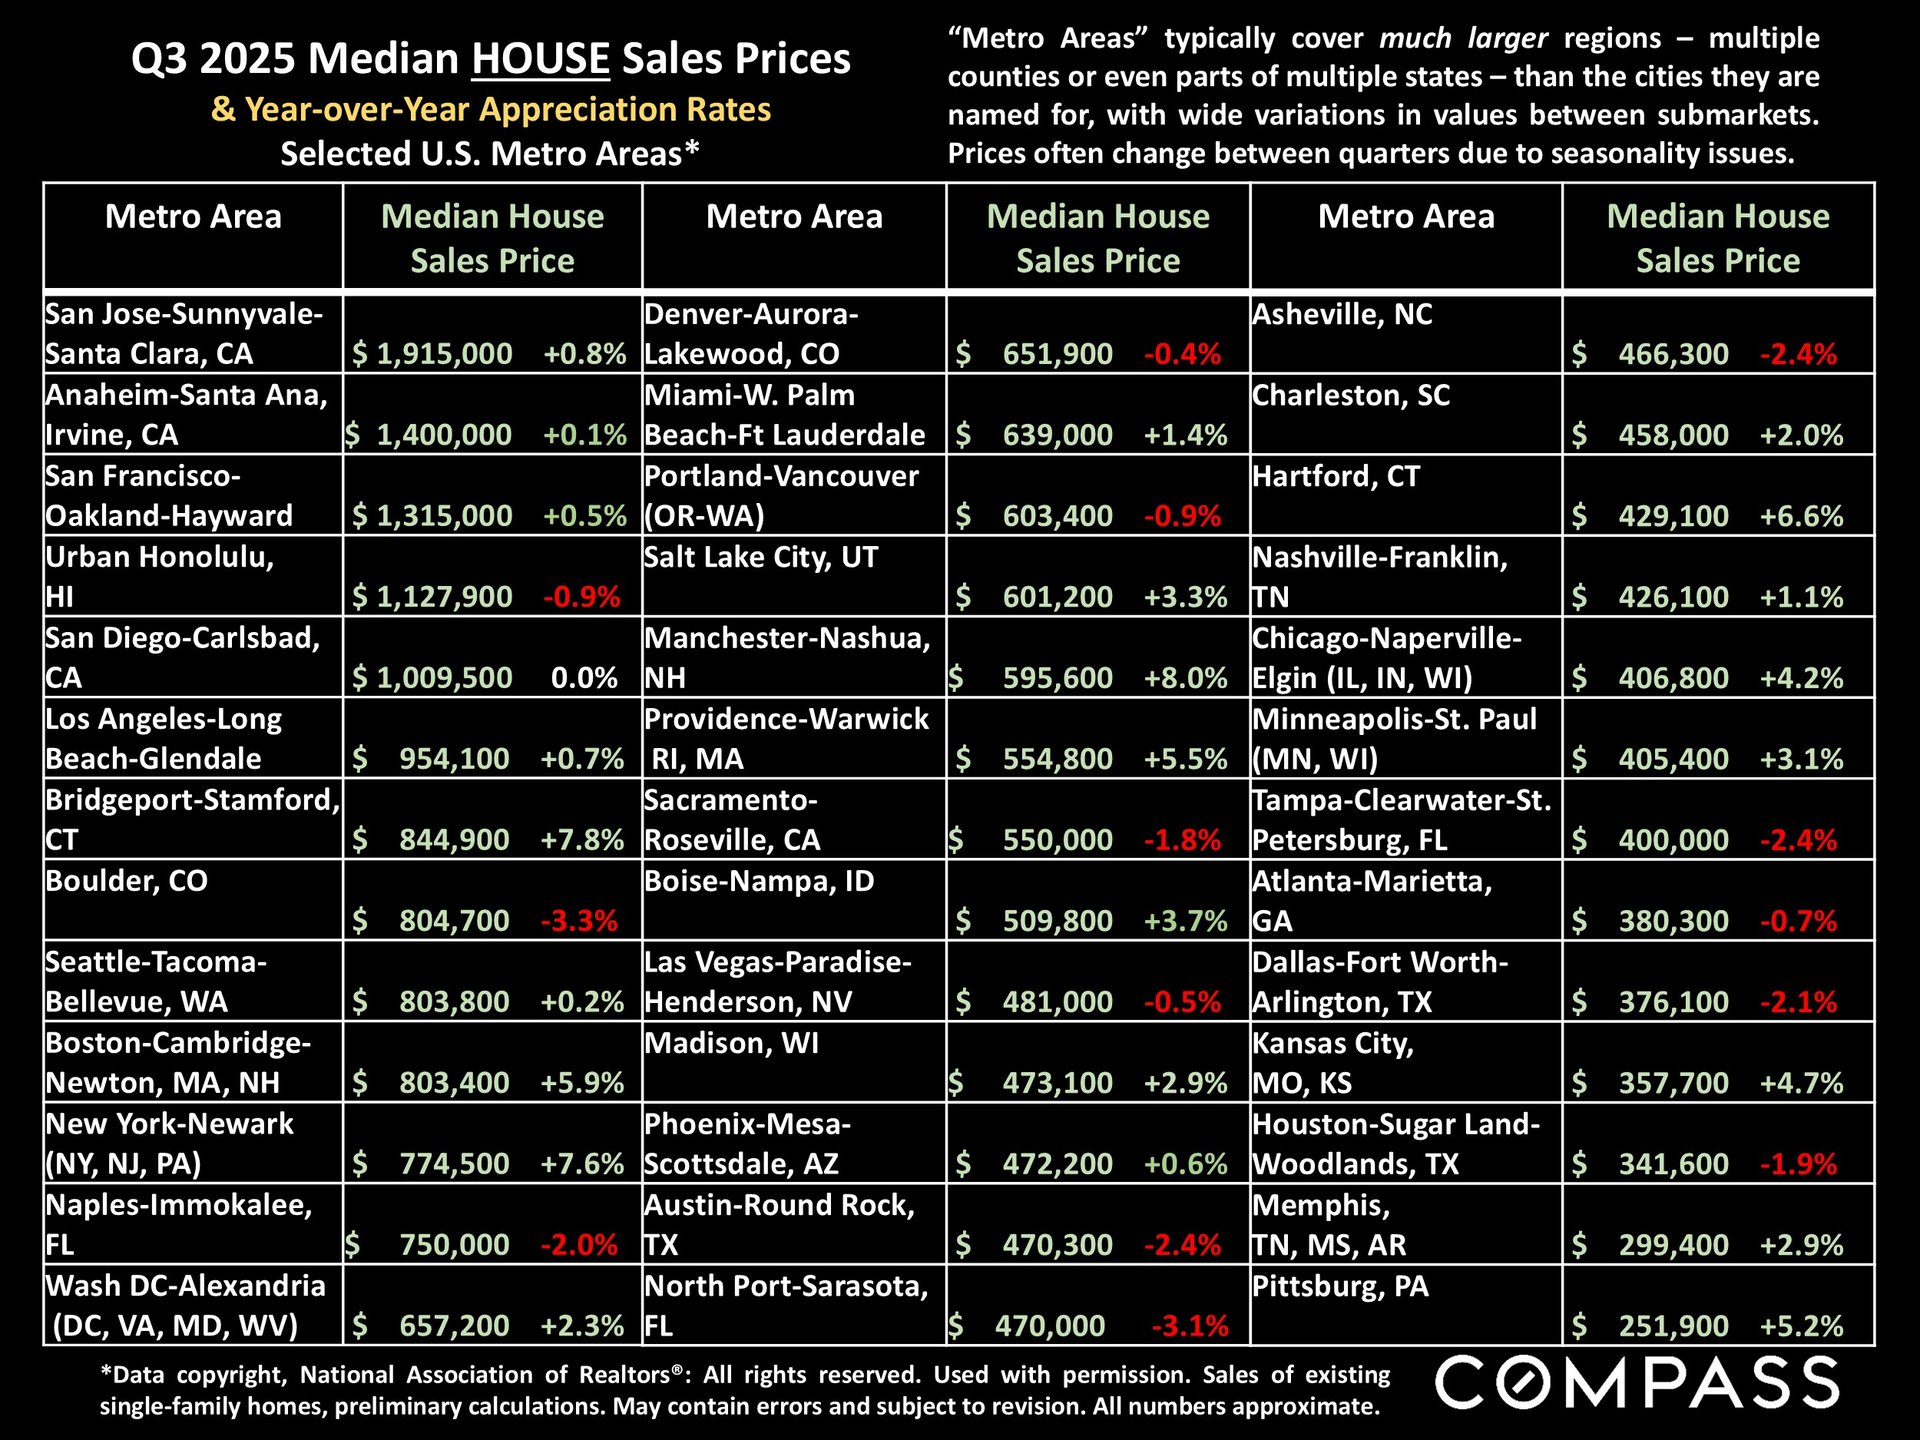
This table reviews Q3 "metro-area" median house prices, as well as year-over-year price changes. Generally speaking, northeast metros have seen the highest appreciation rates over the past year, while those in the south/southeast have been more likely to have had median price declines - but some of the metros with declines had the highest appreciation rates in the previous years. Metro areas typically cover multi-county regions containing a wide range of very different submarkets.
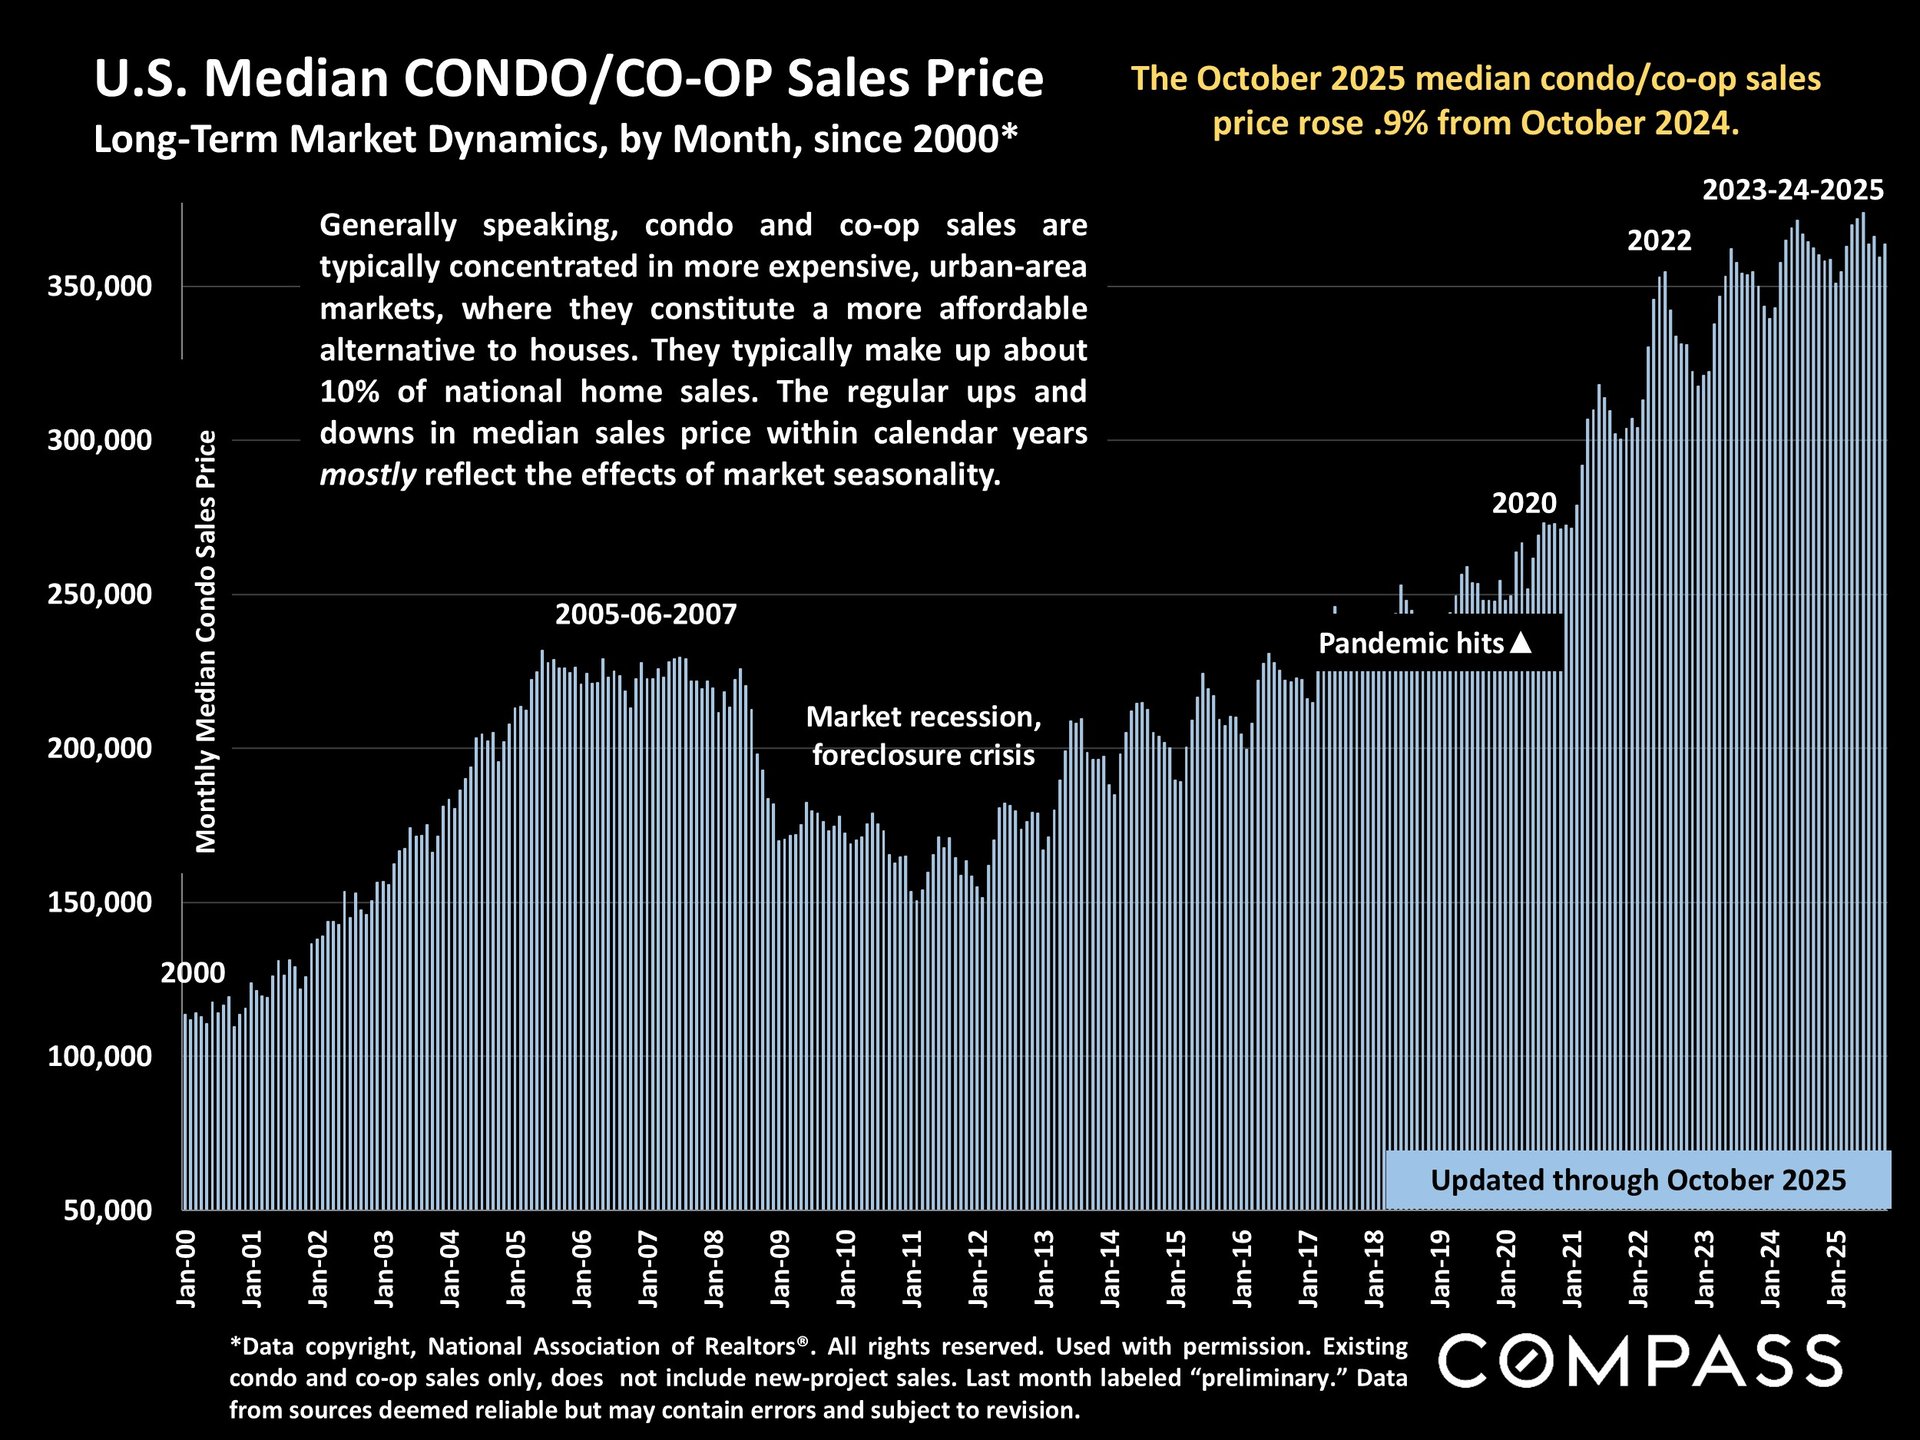
Median condo/co-op sales prices since 2000.
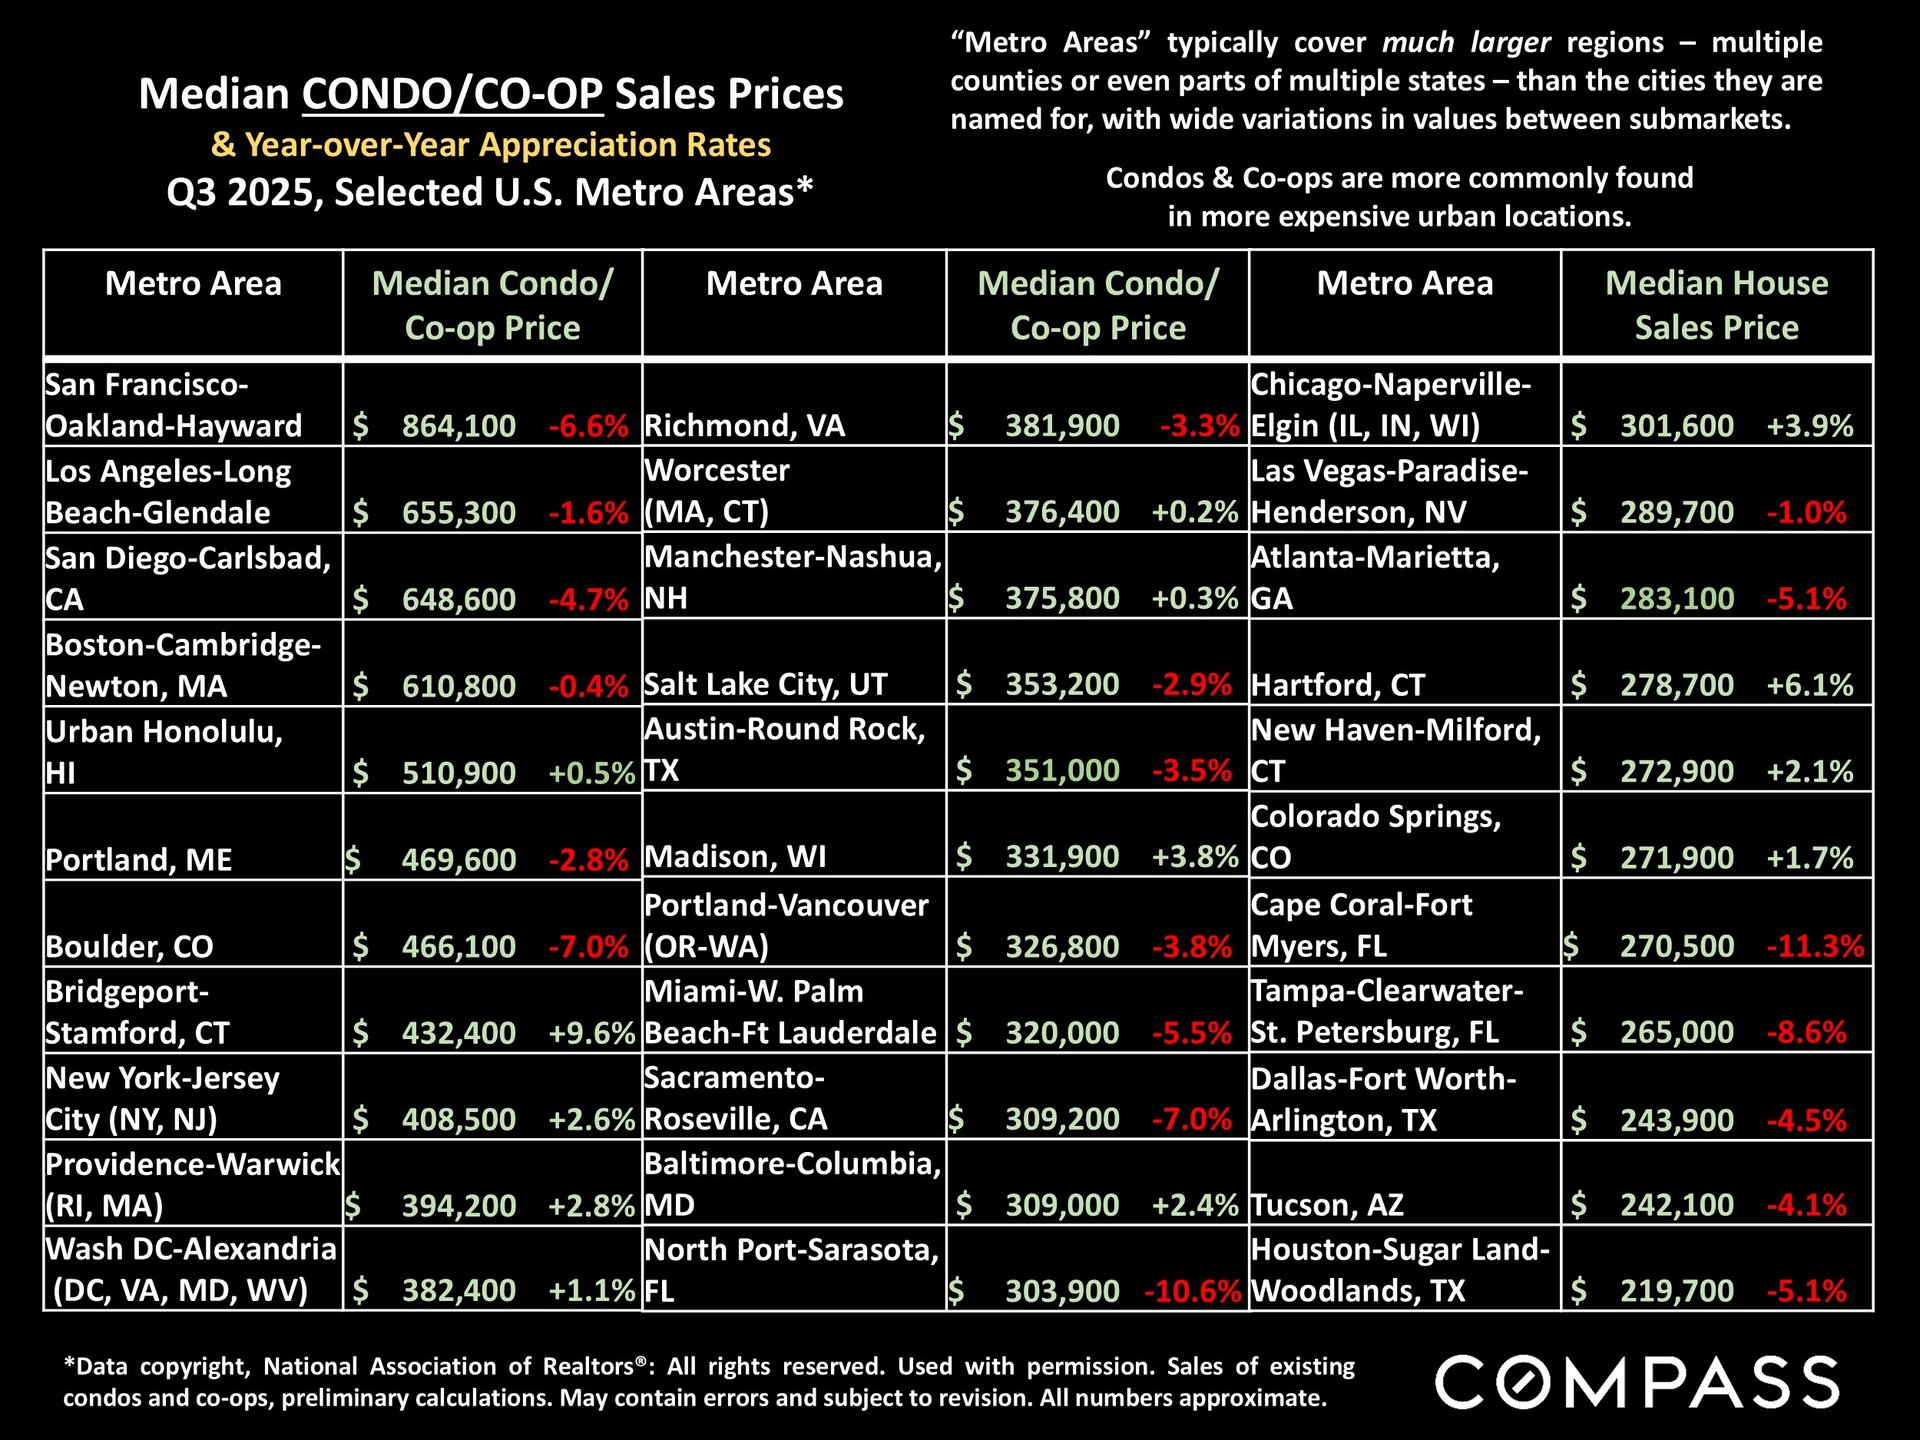
Metro-area median condo/co-op sales prices: Condos and co-ops have been more likely to see year-over-year price declines, though northeast metros have commonly bucked that trend.
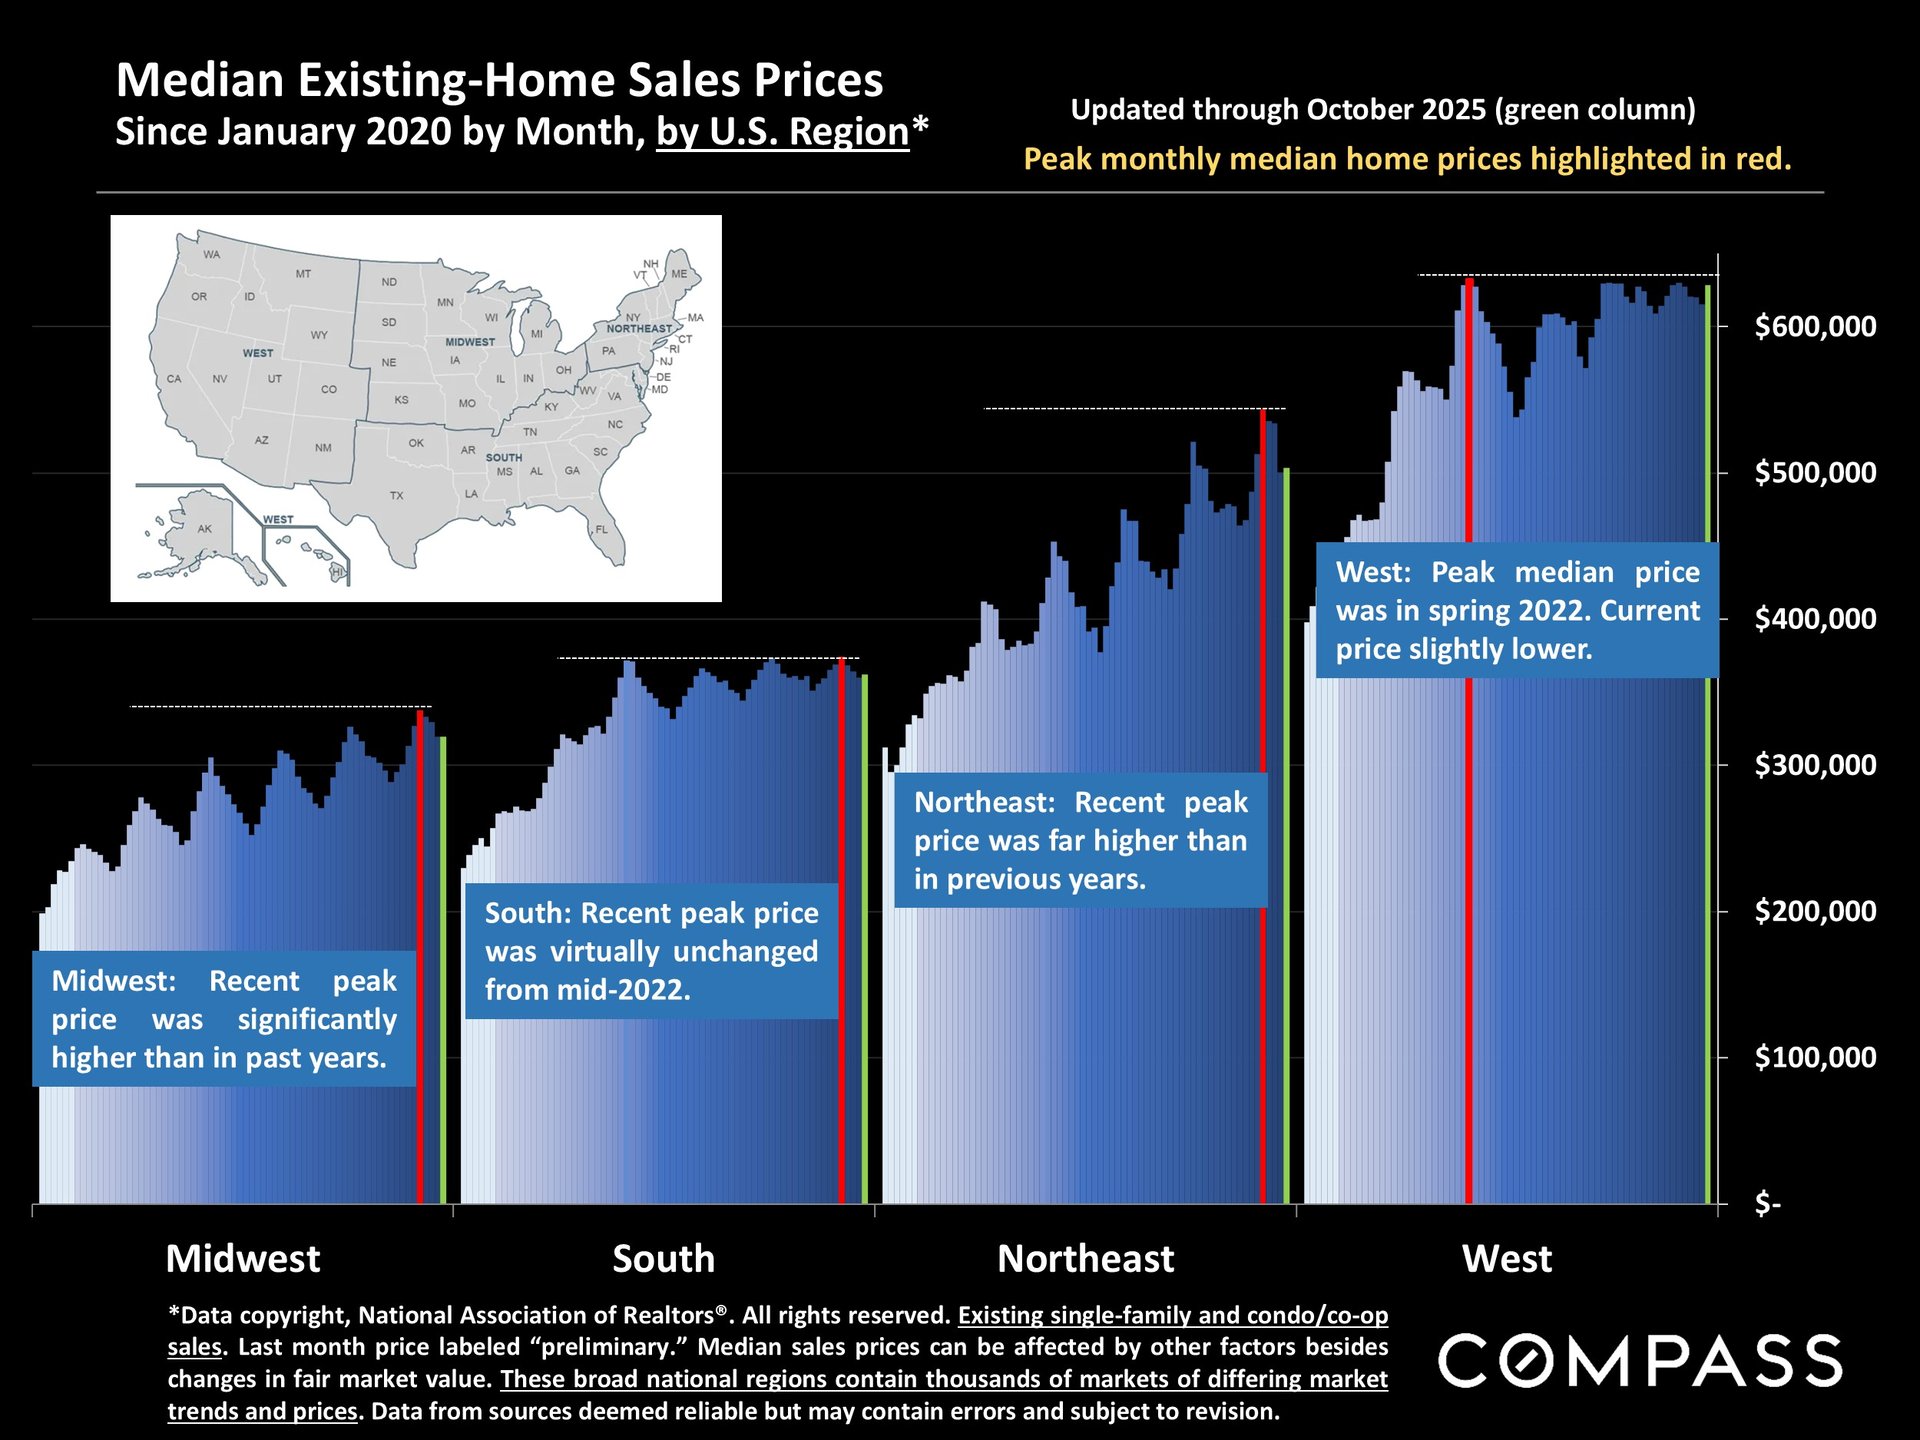
The National Association of Realtors divides the country into 4 very broad regions. The chart below reviews monthly median home prices - for house and condo/co-op sales combined - since January 2020. The red columns identify the month each region hit its all-time peak price during the last 6 years, and the green columns reflect prices in October 2025. The regular ups and downs mostly reflect the effects of market seasonality on home prices.
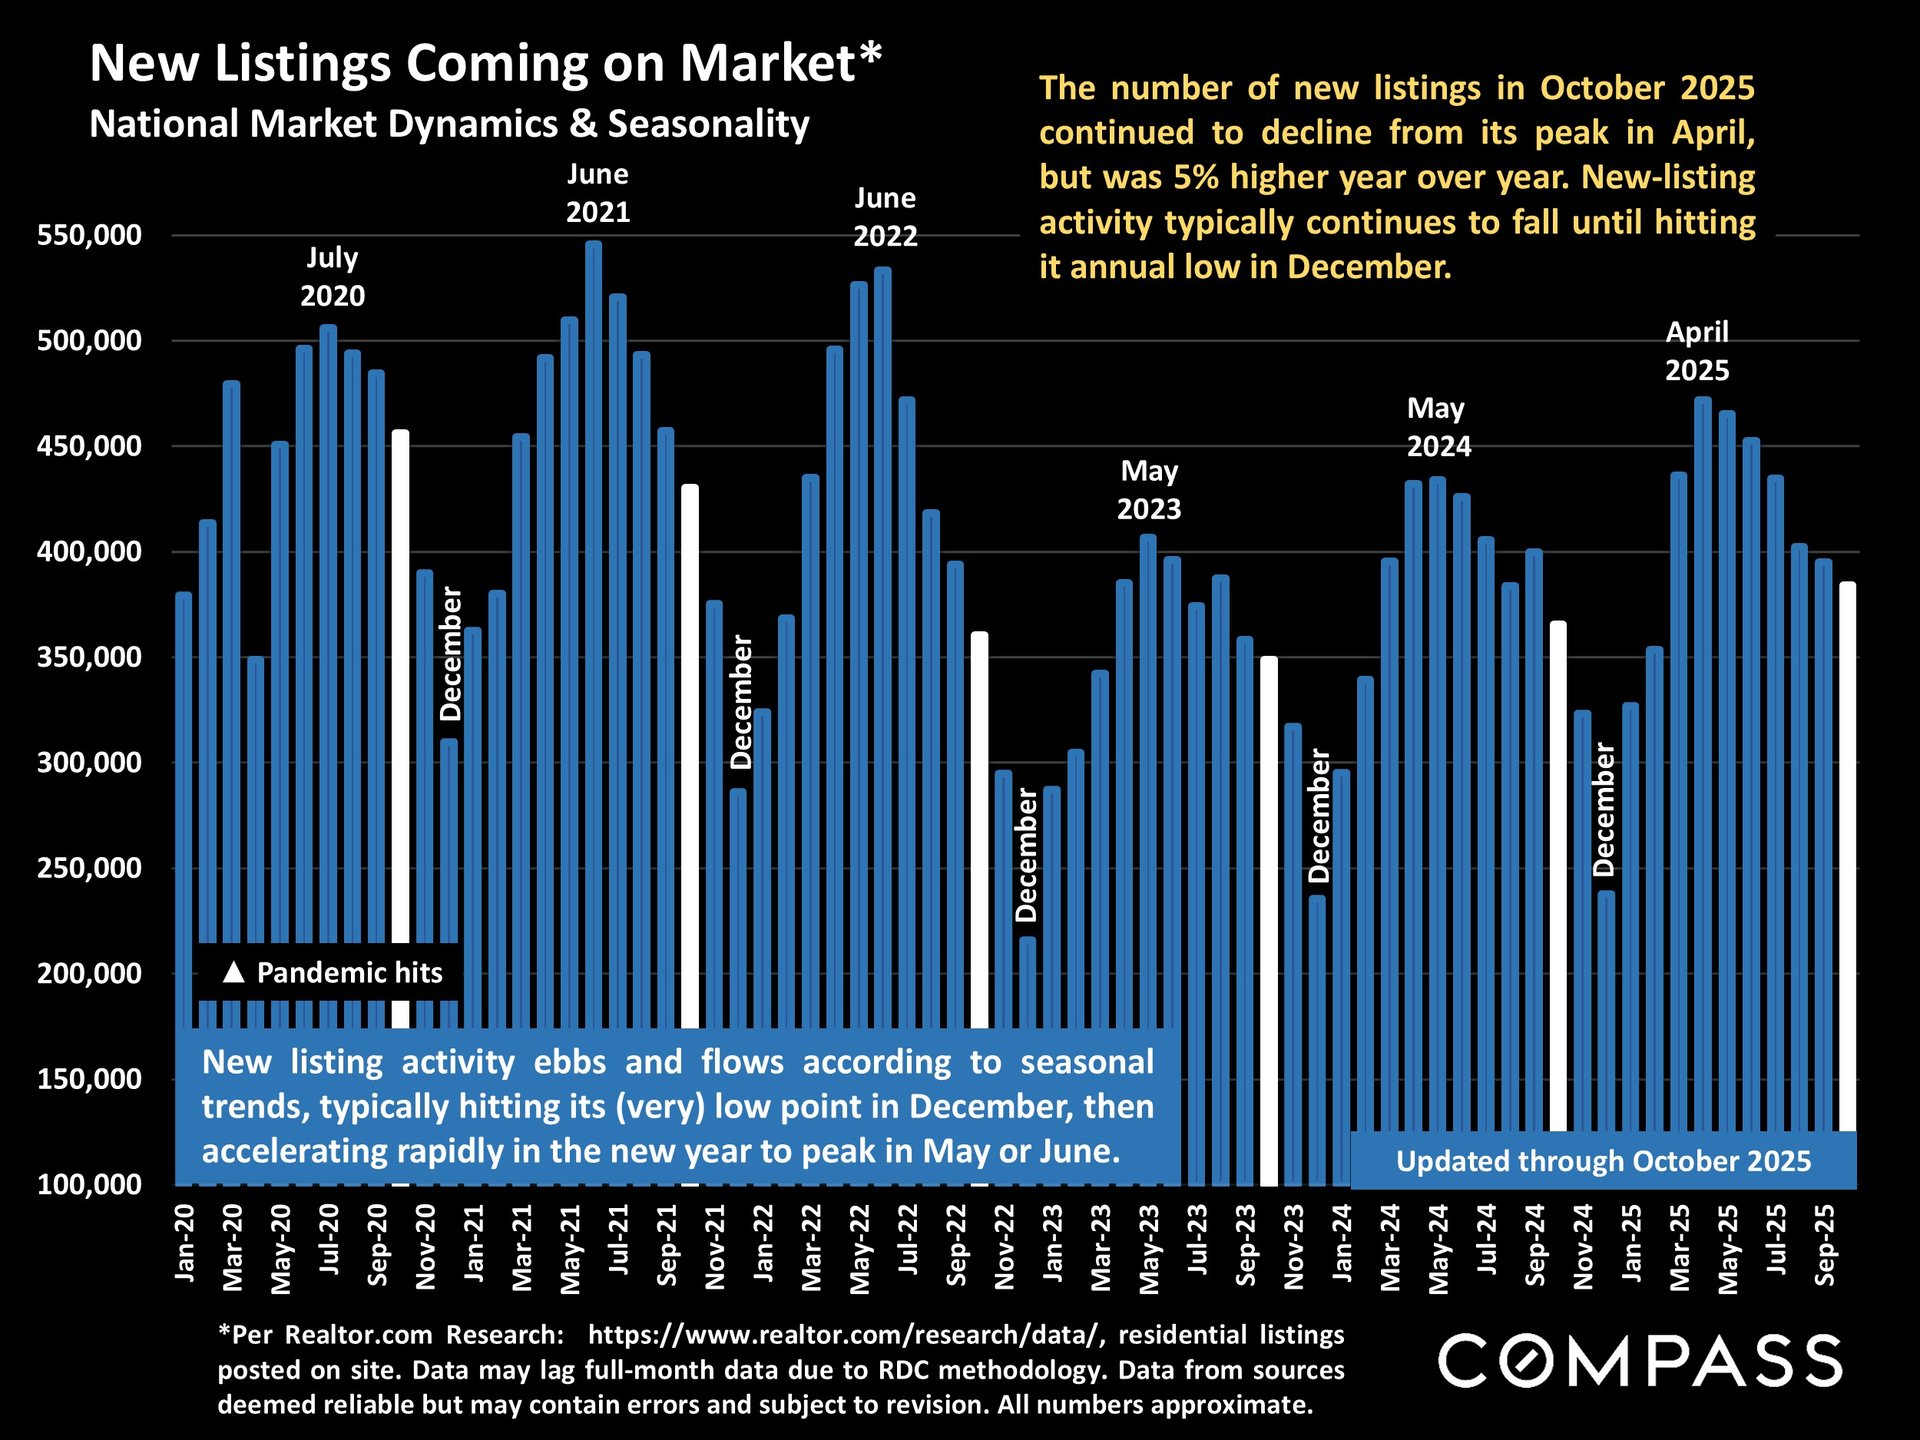
The number of new listings has been gradually falling from its normal peak in spring, but was 5% higher year over year. As can be seen, new listings usually plummet in December before beginning to climb again in the new year.
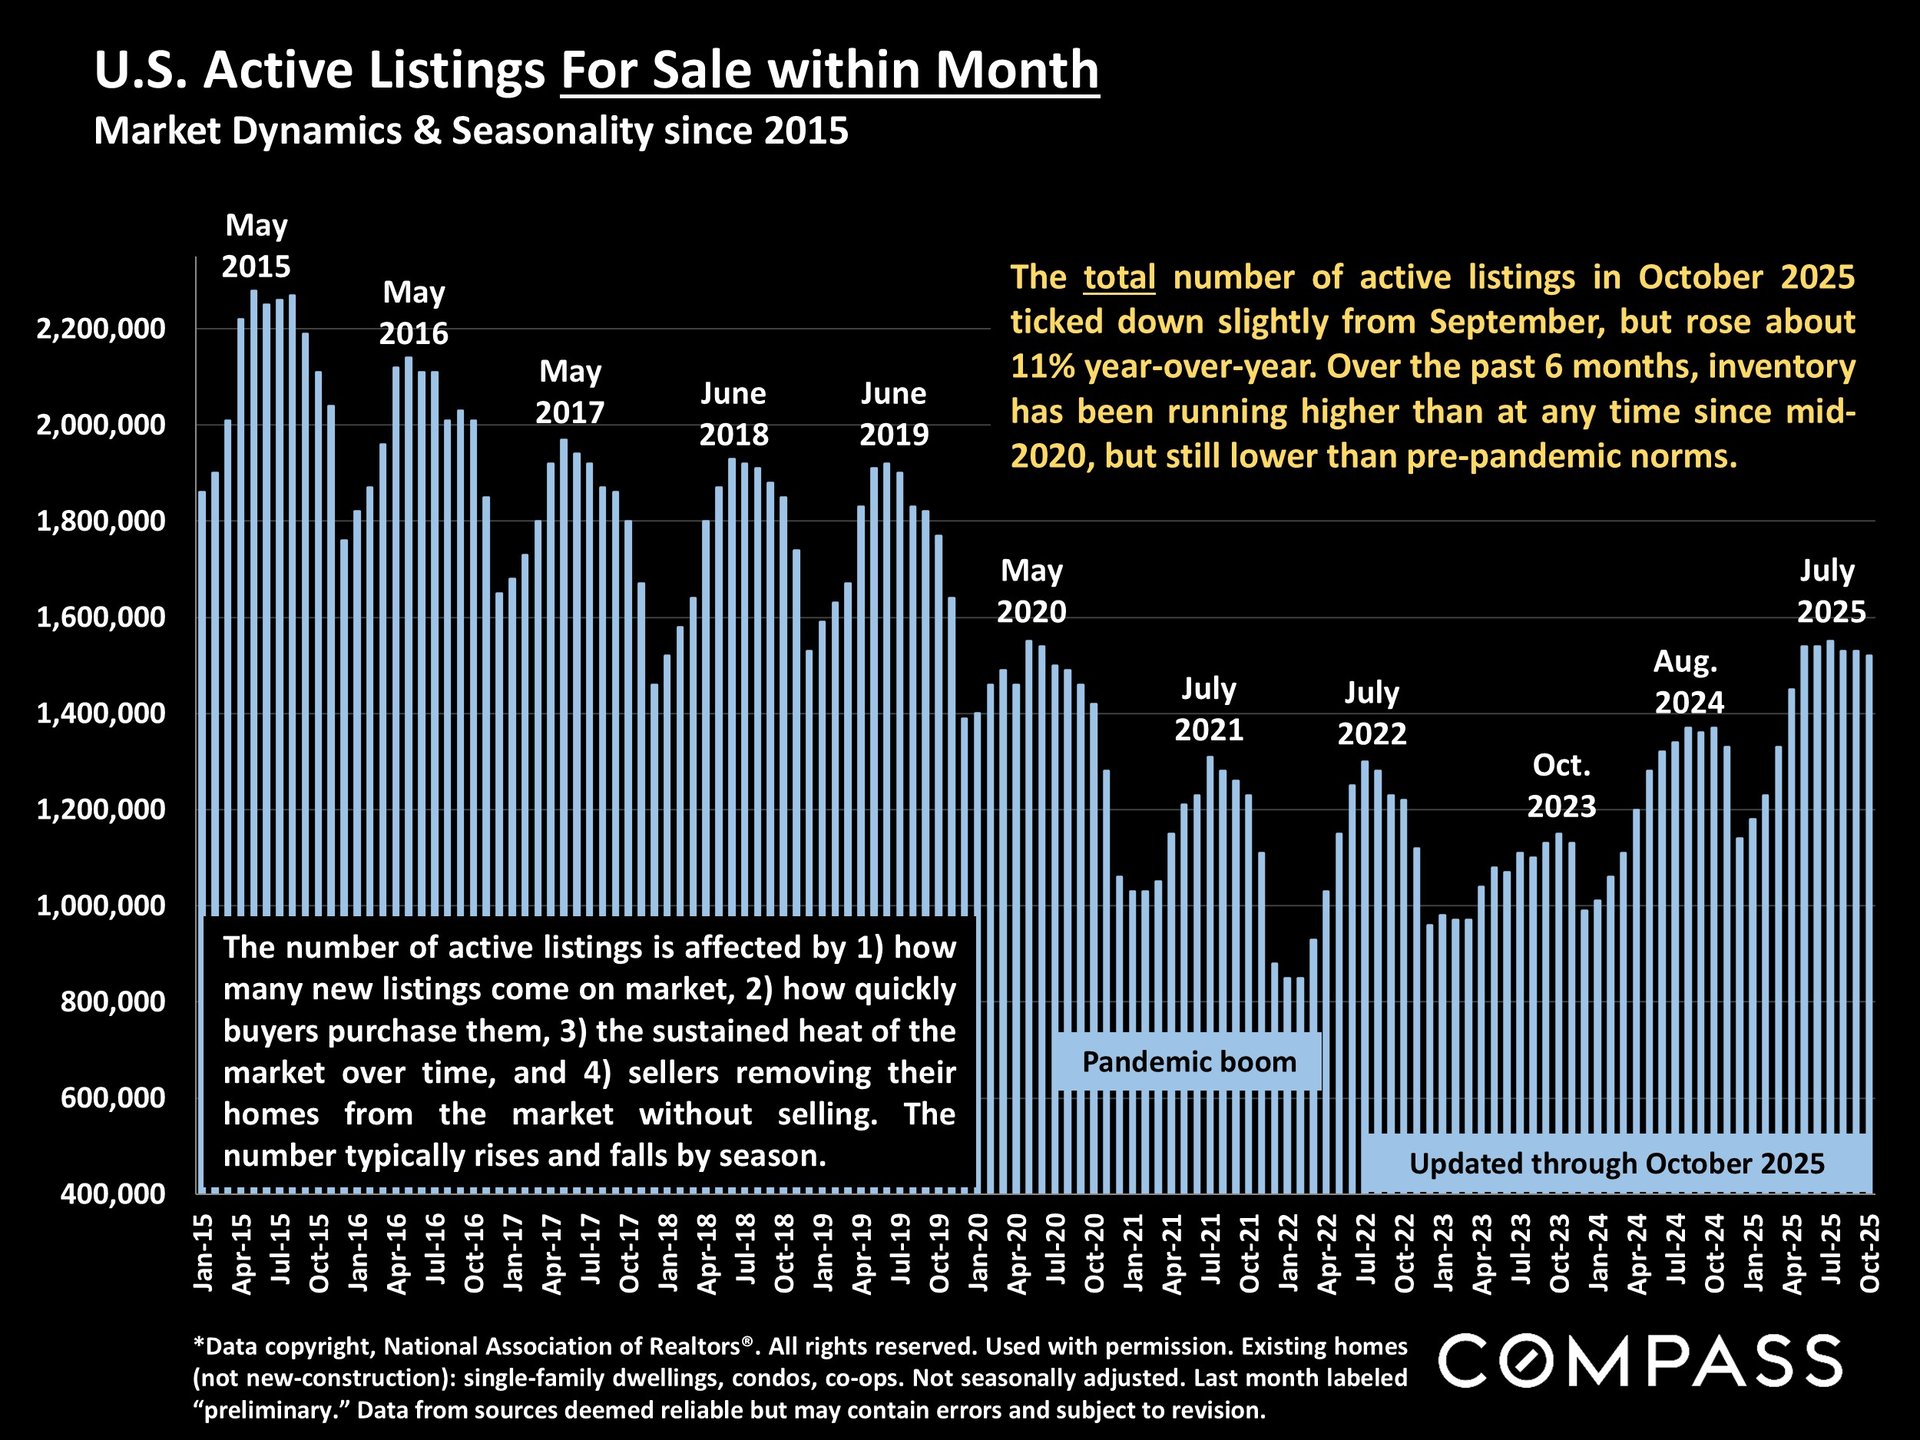
Monthly year-over-year increases in the number of active listings have been rapidly declining in recent months, but October 2025 still had an 11% increase over October 2024. Inventory is generally running at its highest level since 2020, but significantly lower than long-term norms.
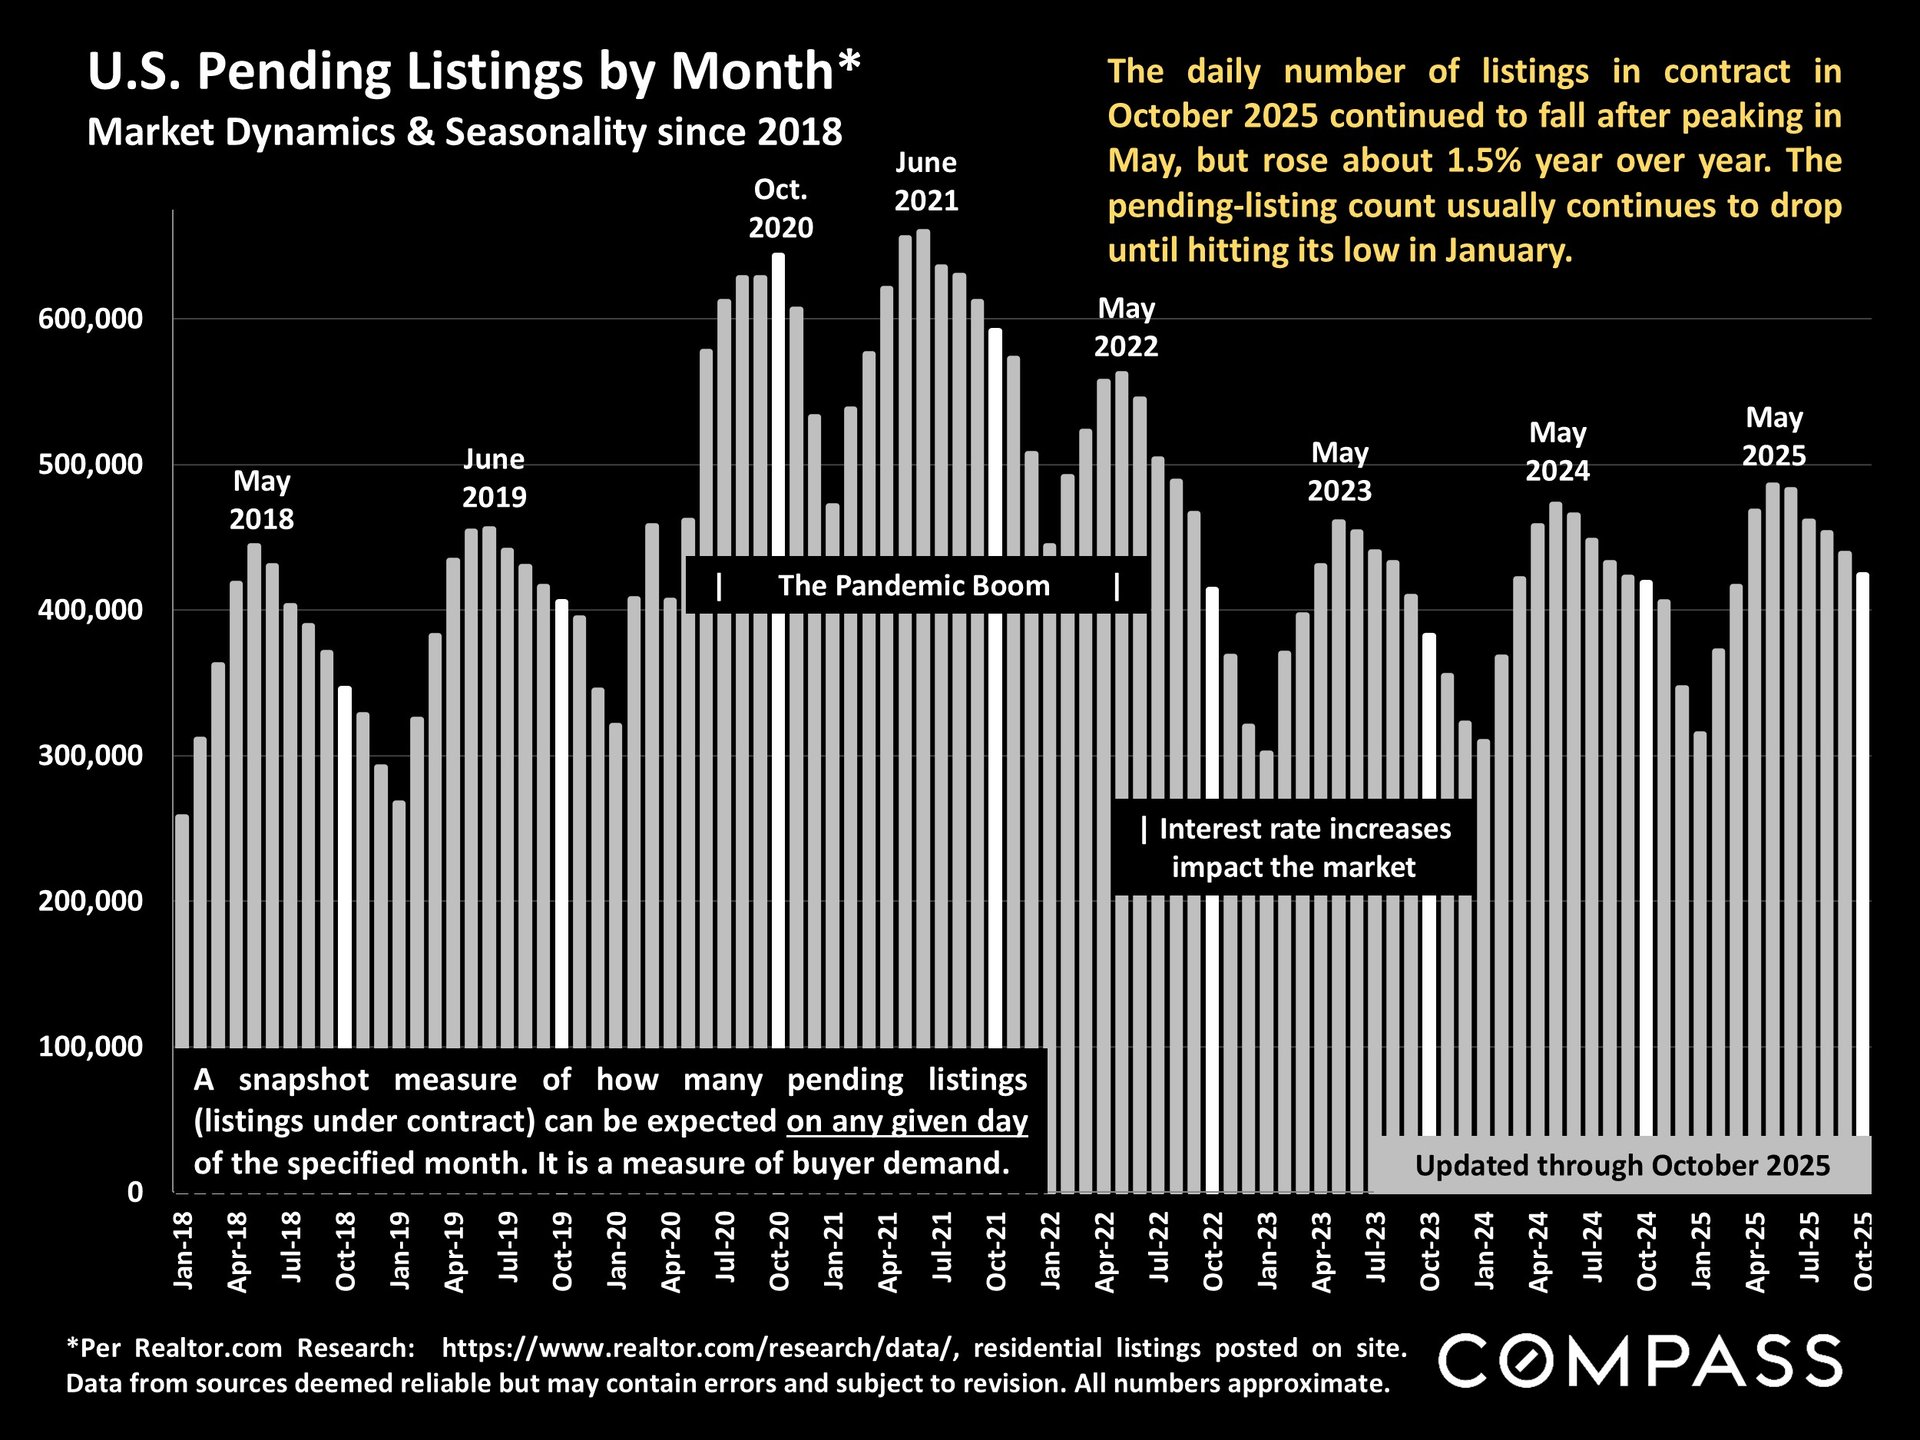
Pending-listing activity - reflecting listings accepting offers - typically peaks each year in spring and hits its low point in mid-winter. It was slightly higher in October on a year-over-year basis.
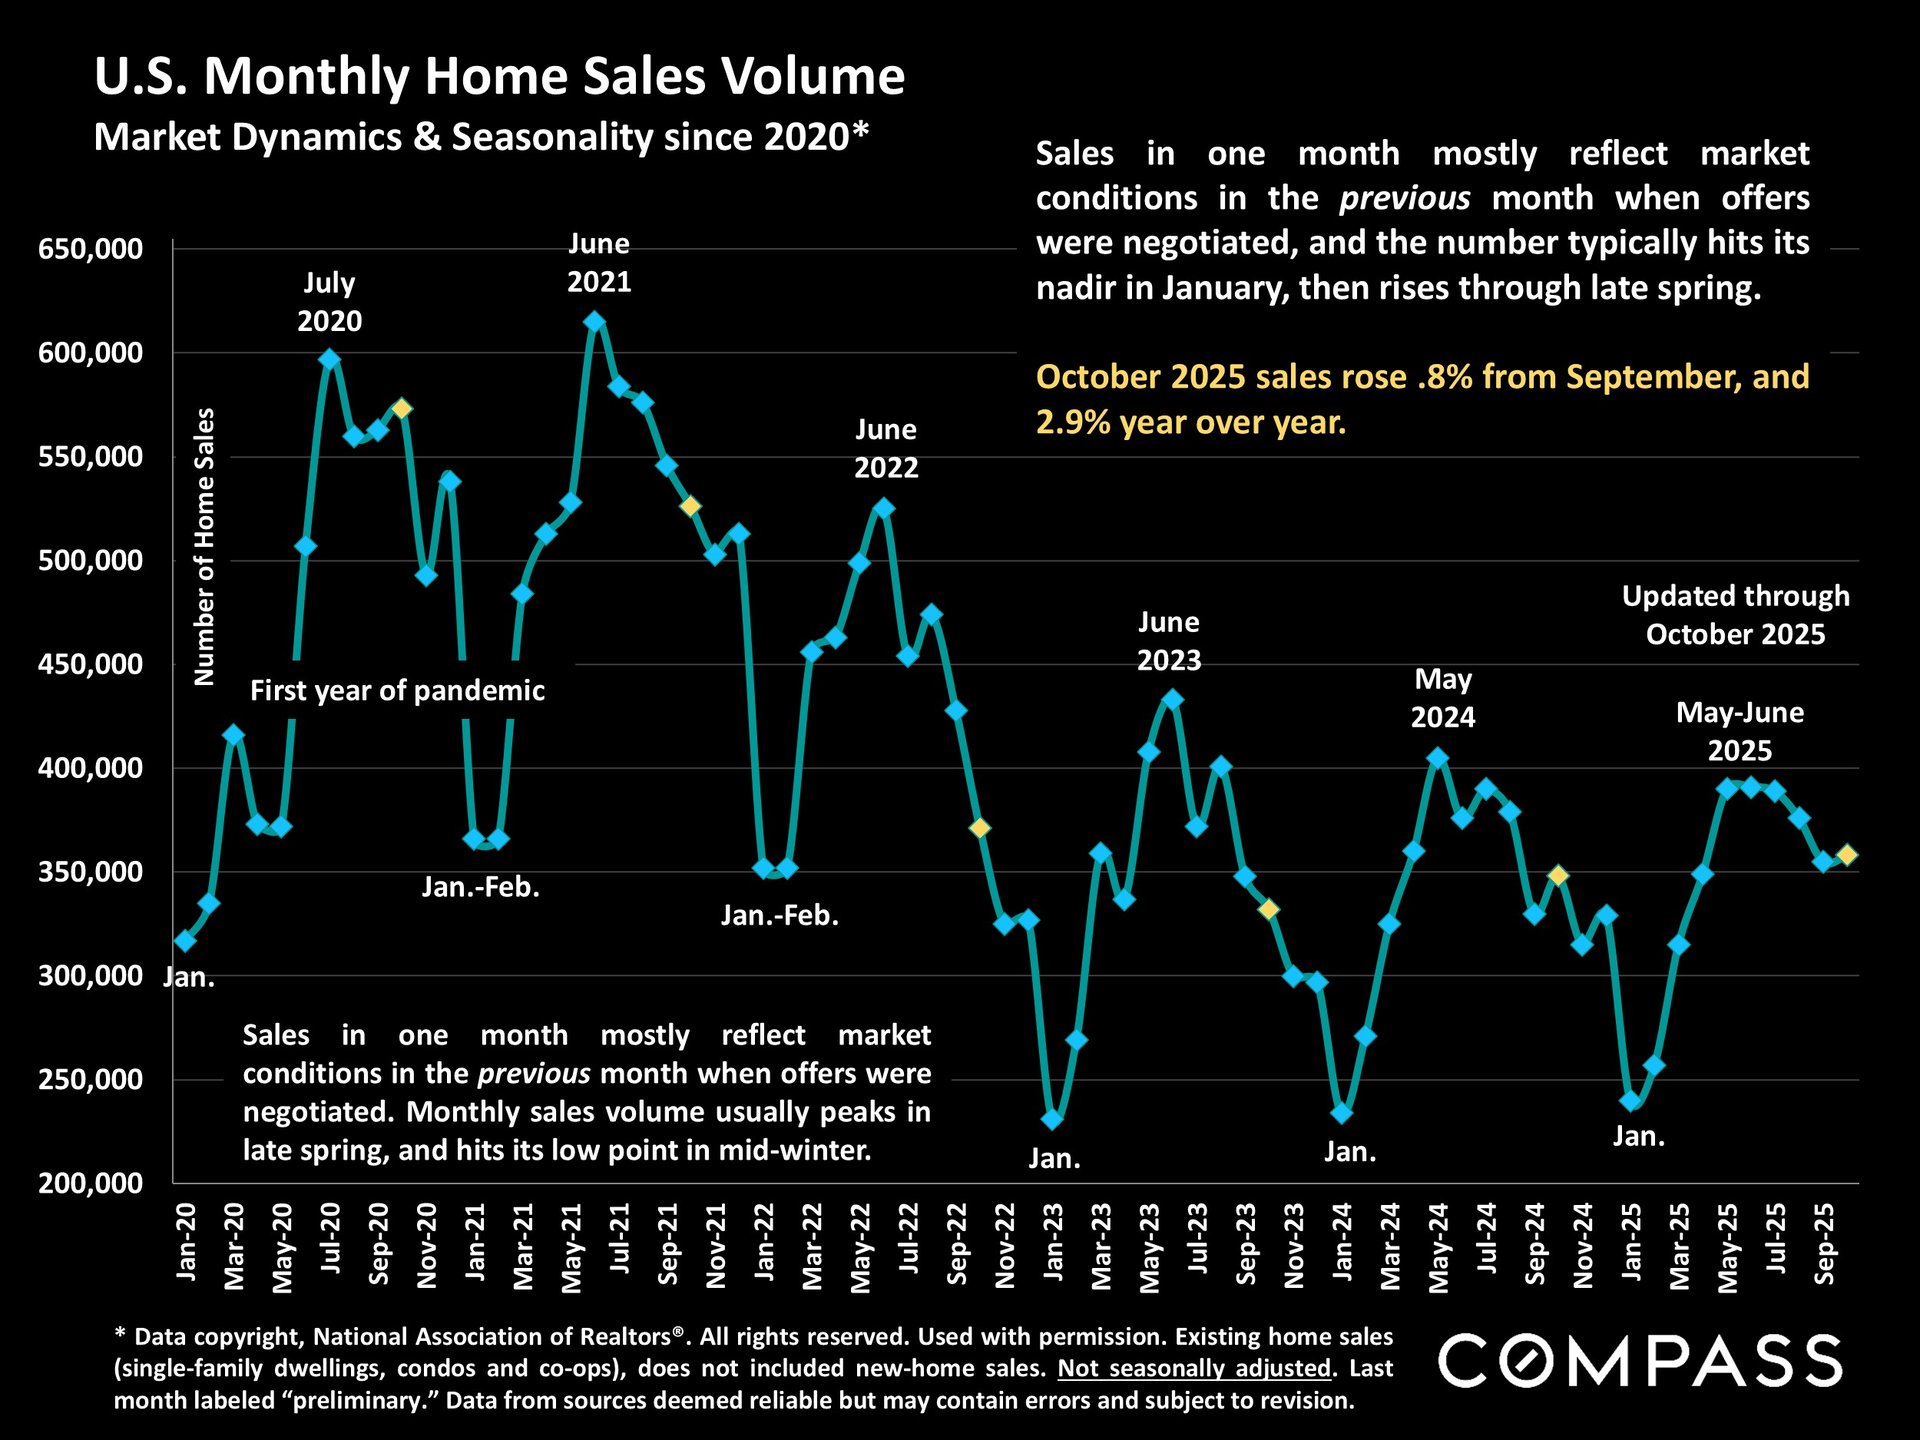
Sales ticked up from September and increased almost 3% from October 2024, but remained extremely low by long-term standards.
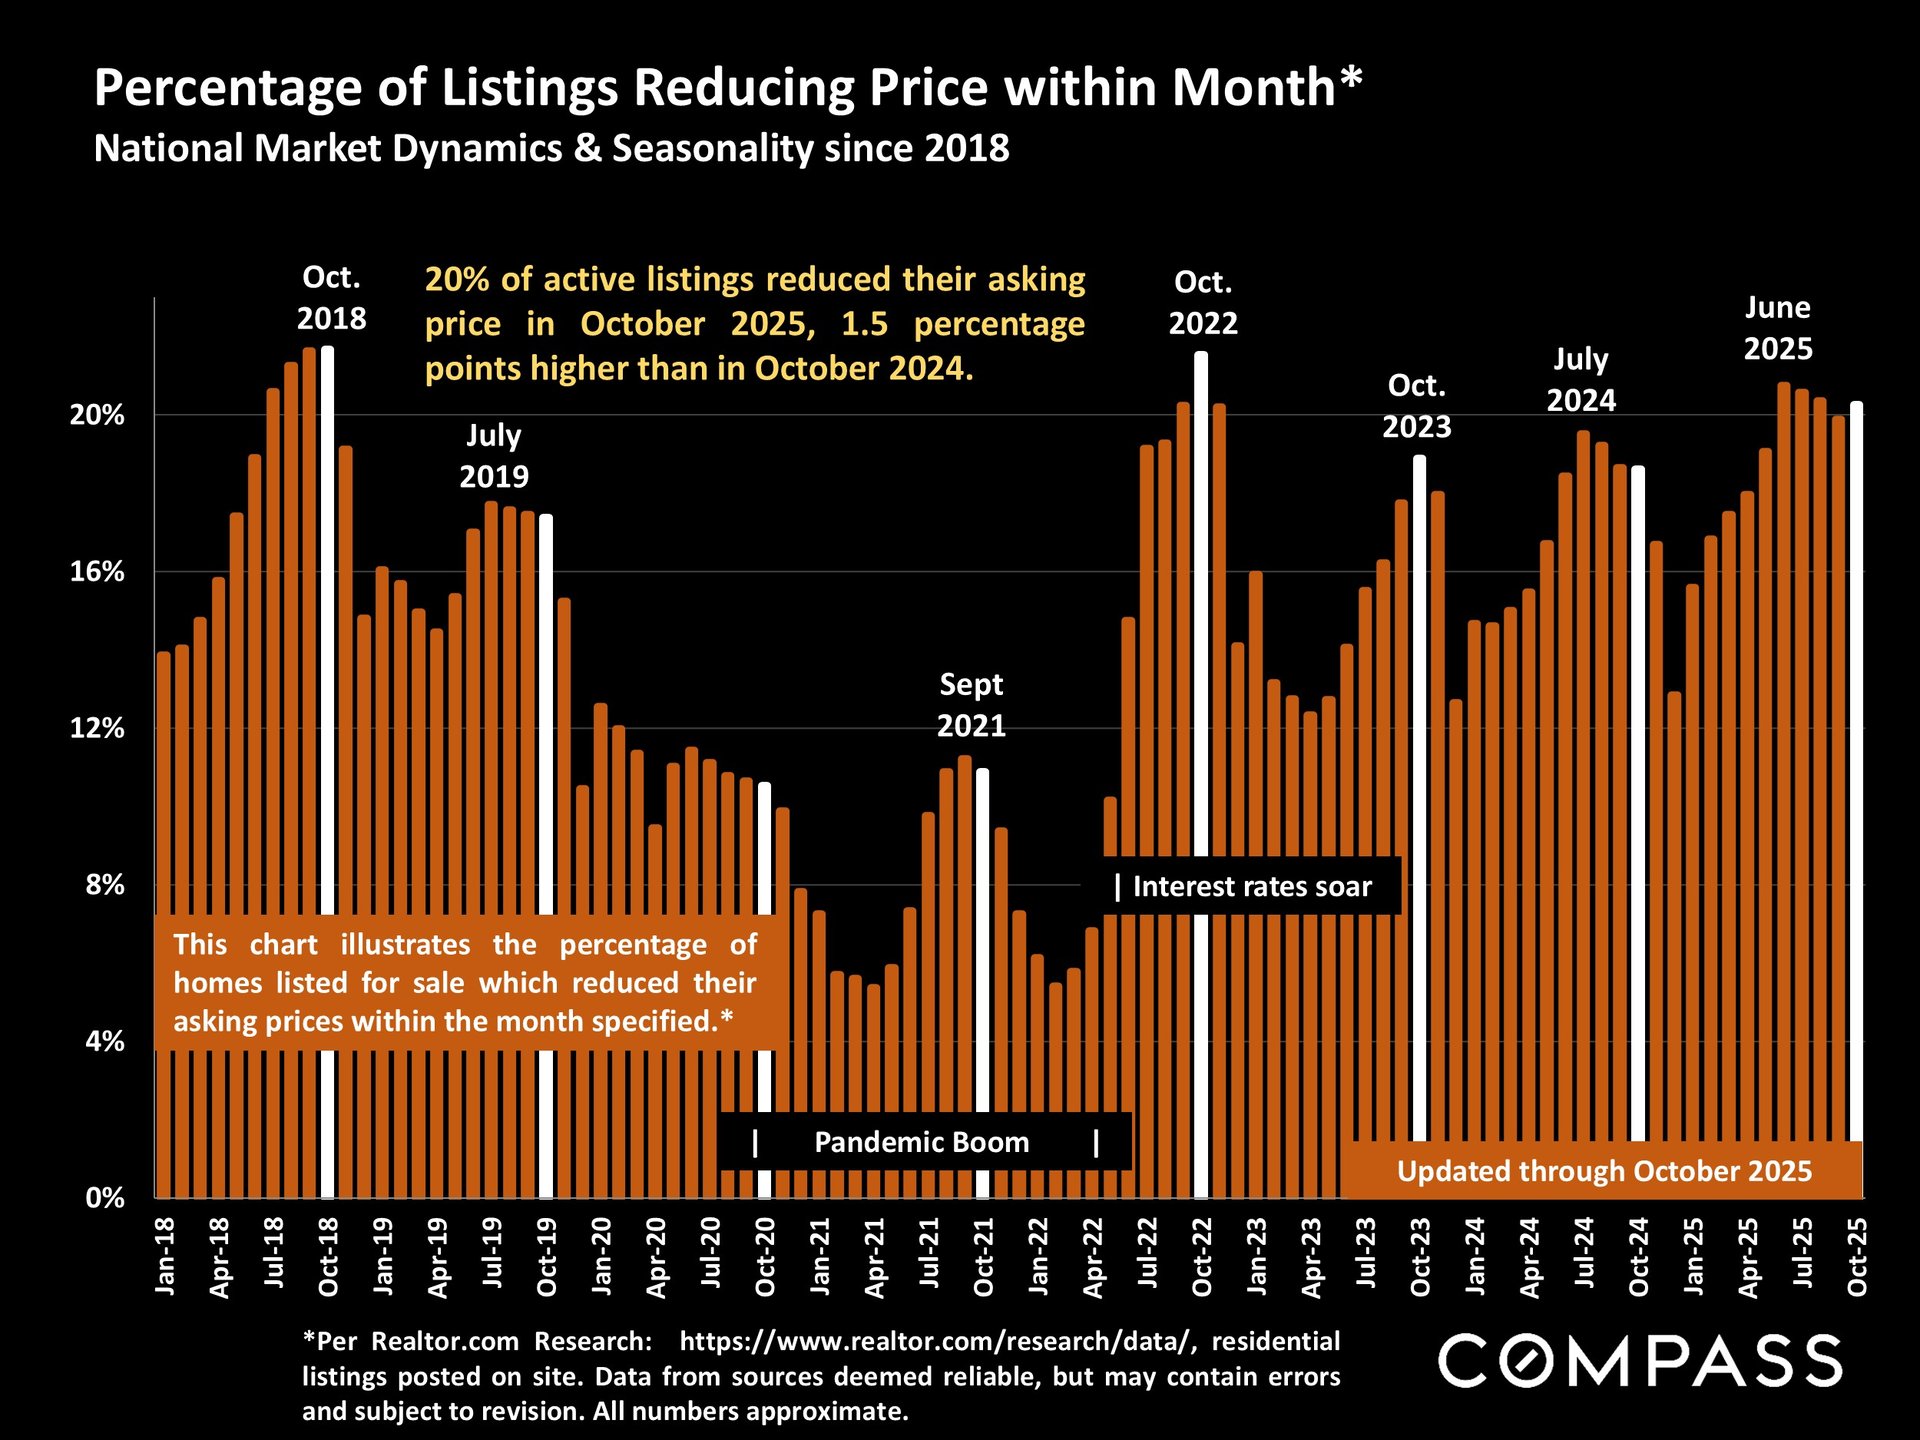
The number of price reductions in October rose 20%, but the percentage of active listings which reduced price during the month - illustrated below - barely rose from last year: With many more active listings, a similar percentage translated into a much higher number of reductions.
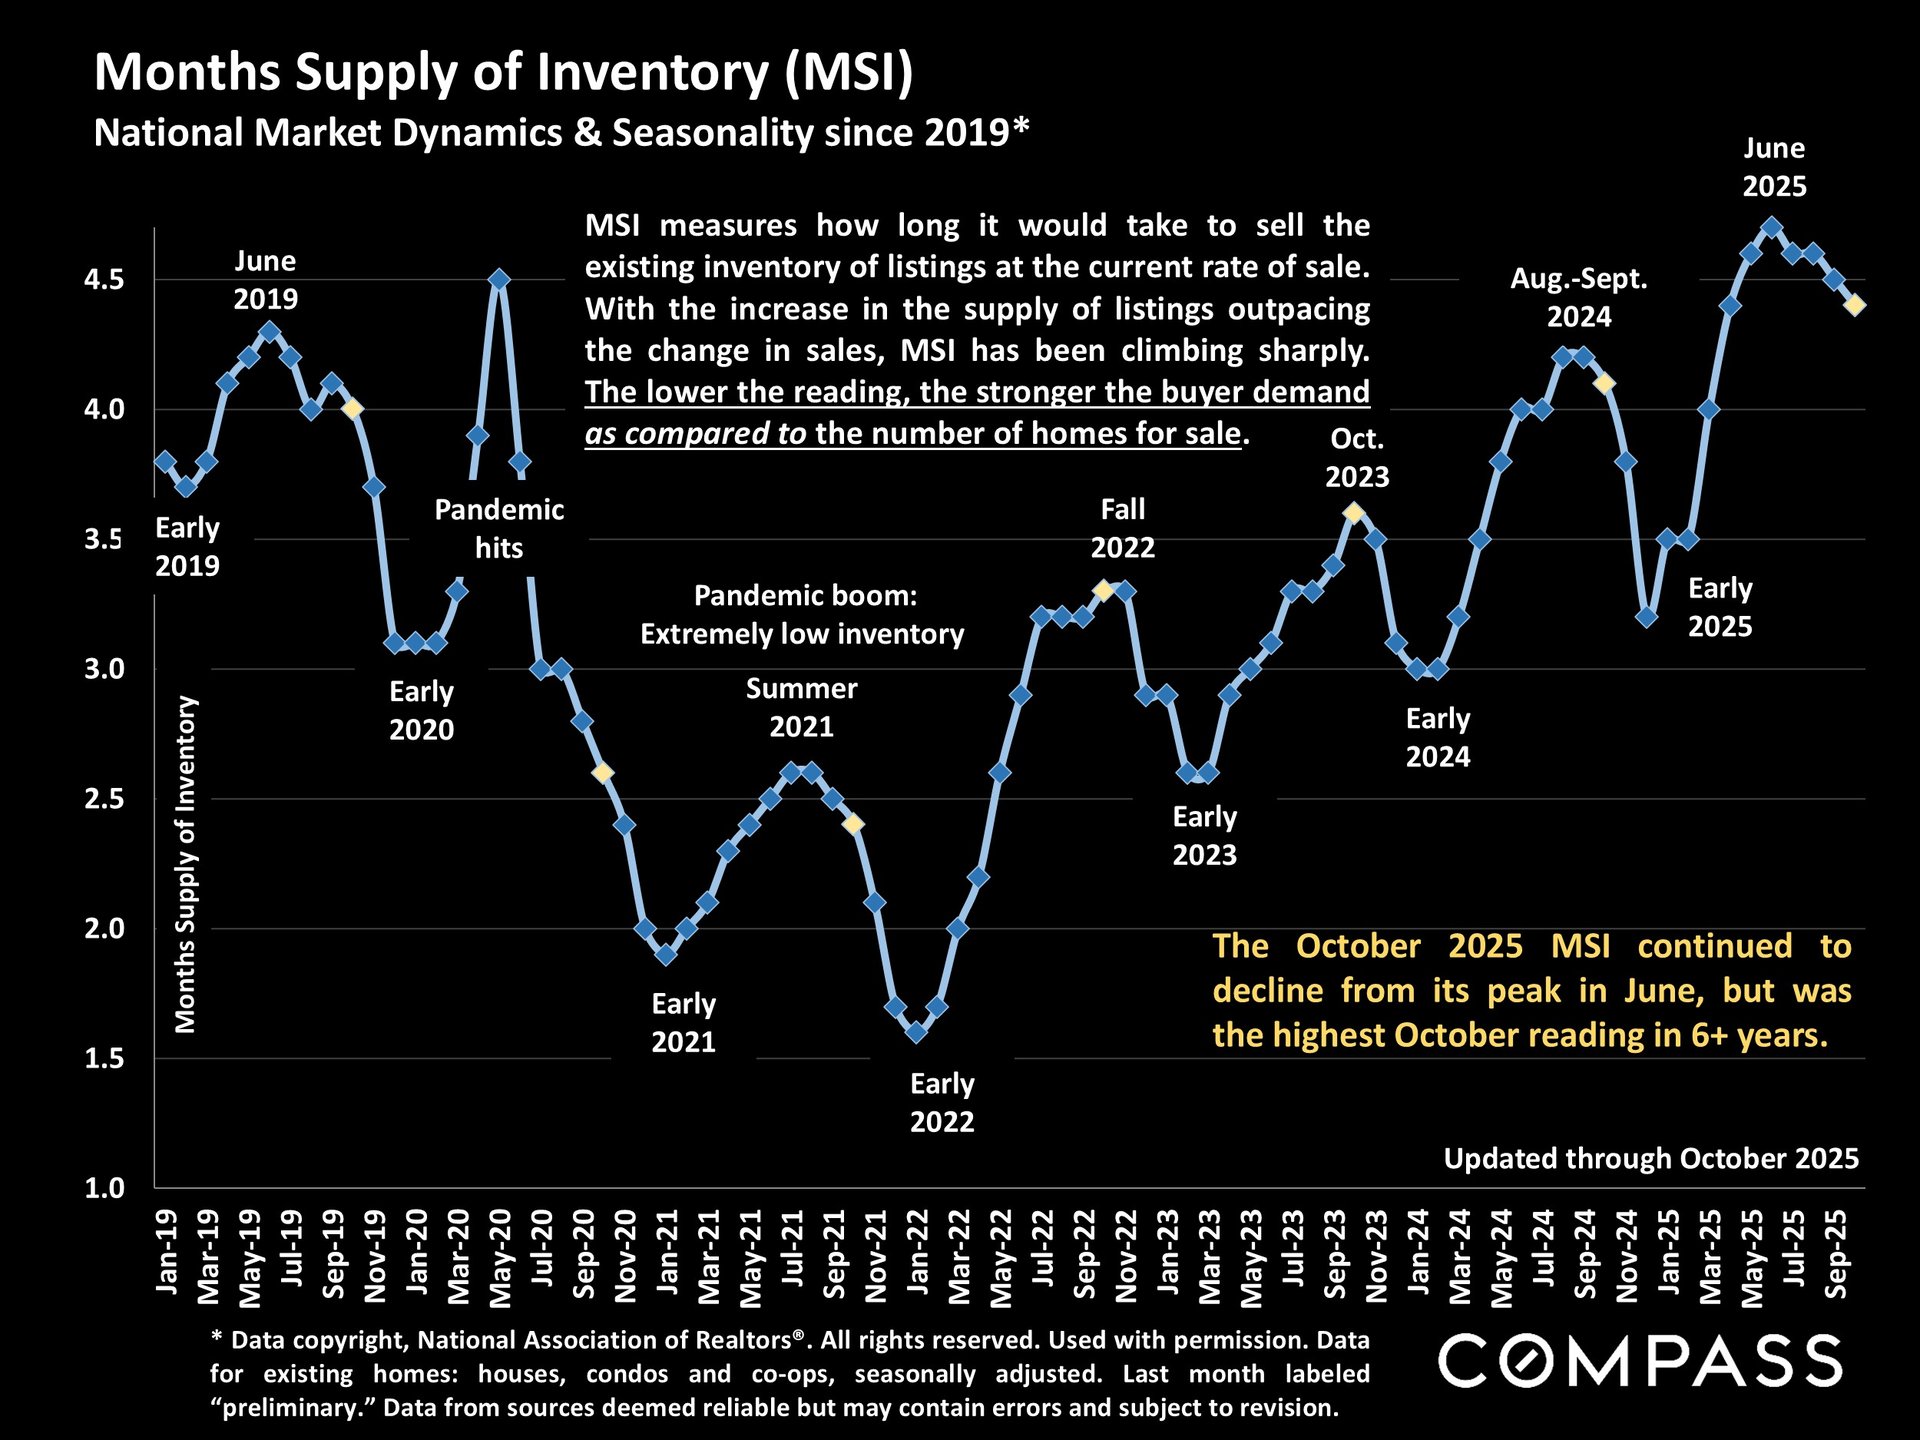
Months supply of inventory (MSI): The lower the reading, the higher the demand as compared to the supply of homes for sale. MSI has been falling since June due to increased demand, but running higher than last year due to the year-over-year increase in listings.
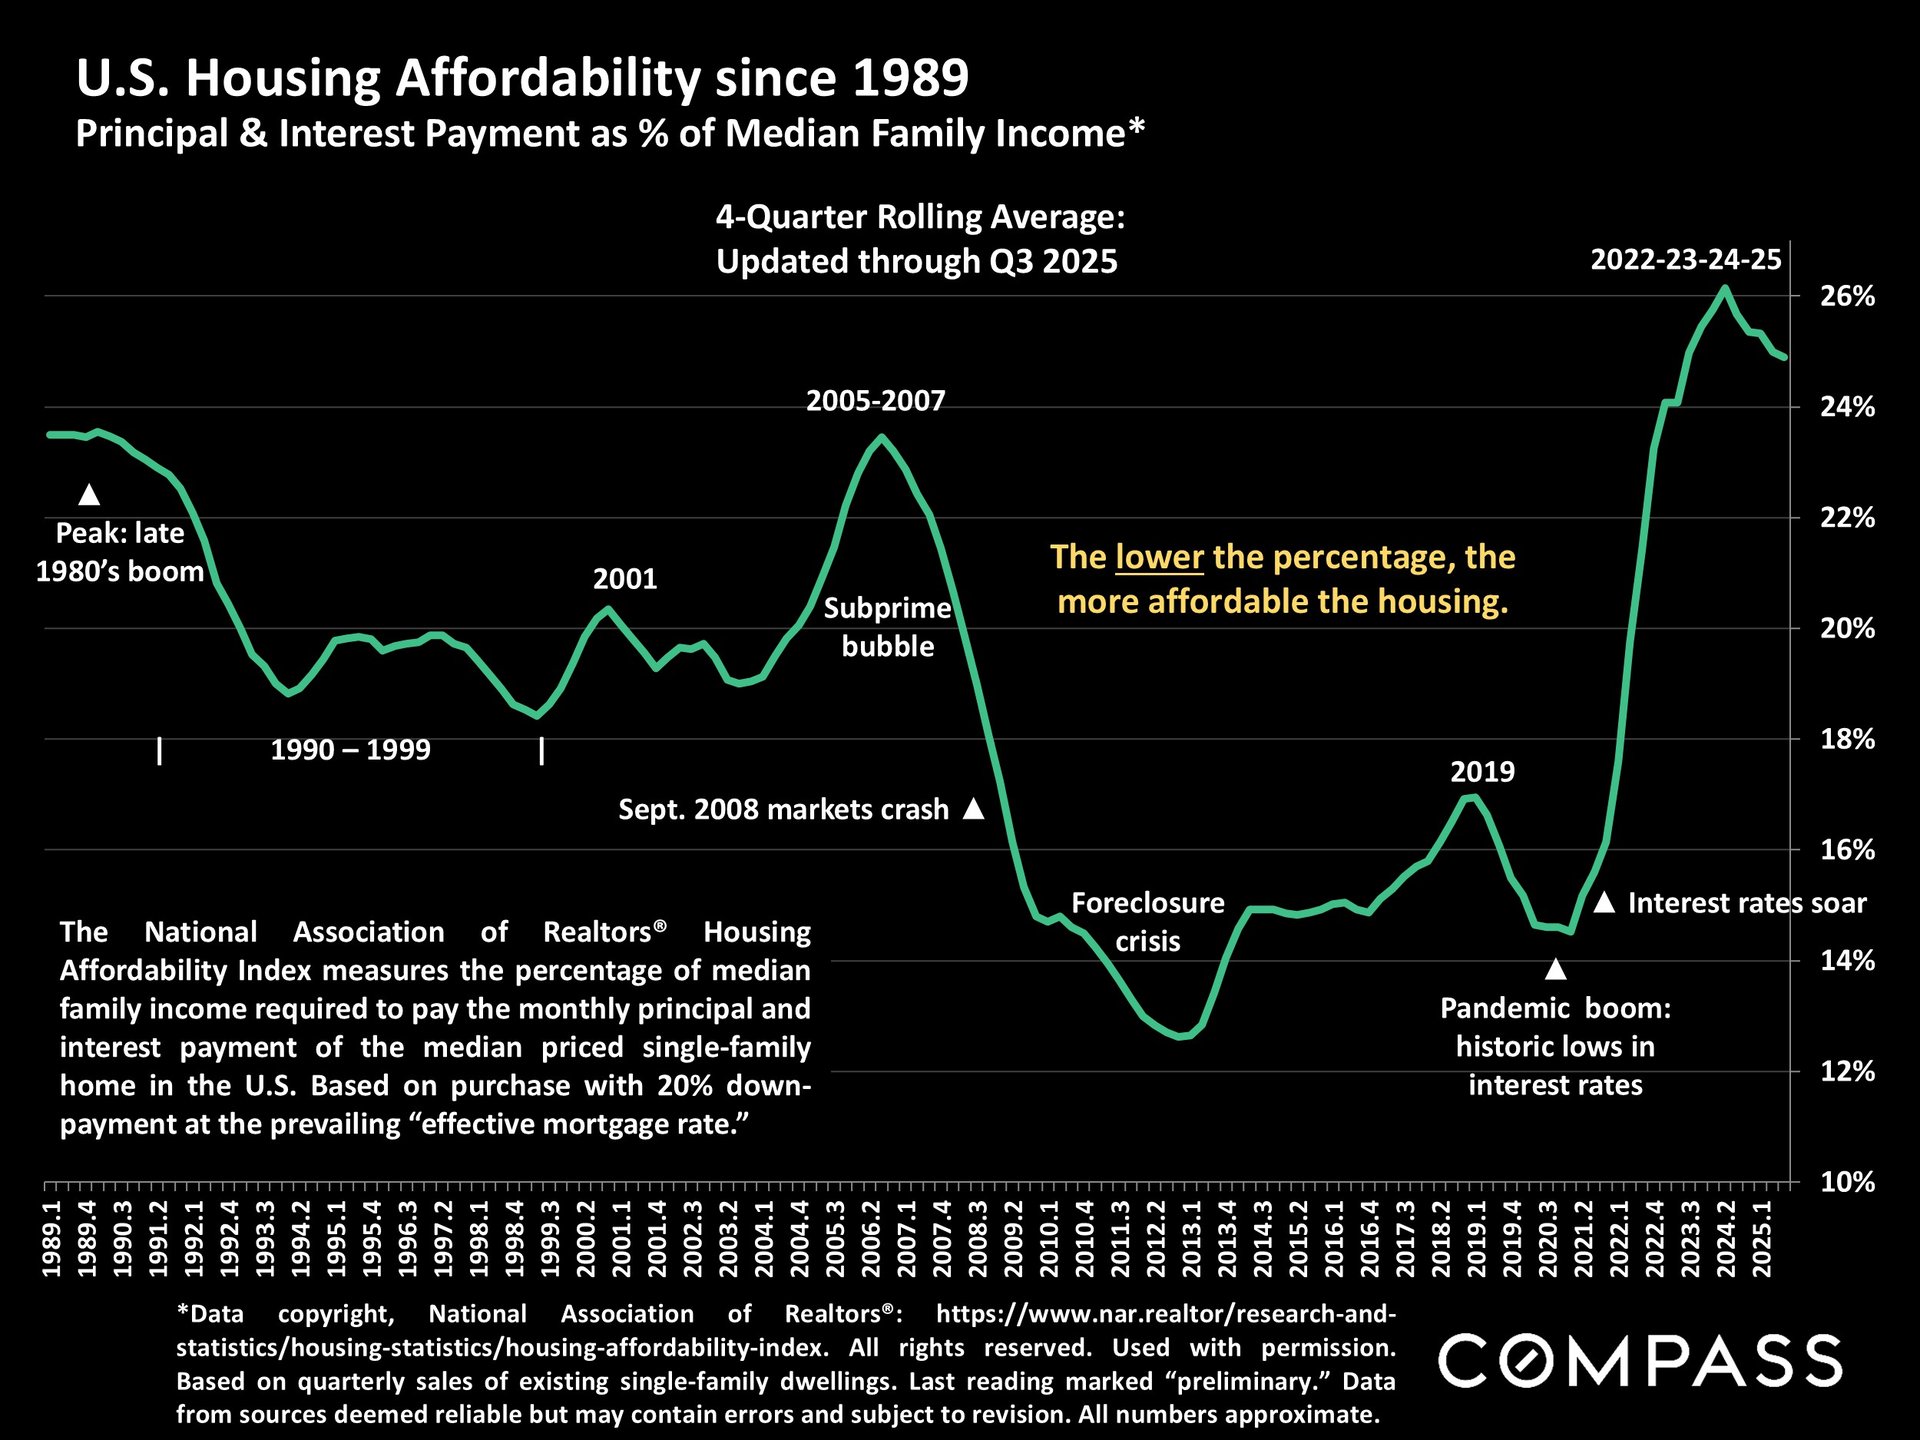
On this chart higher readings signify less affordability. Housing affordability remains a huge issue, but it has been improving with the decline in interest rates.
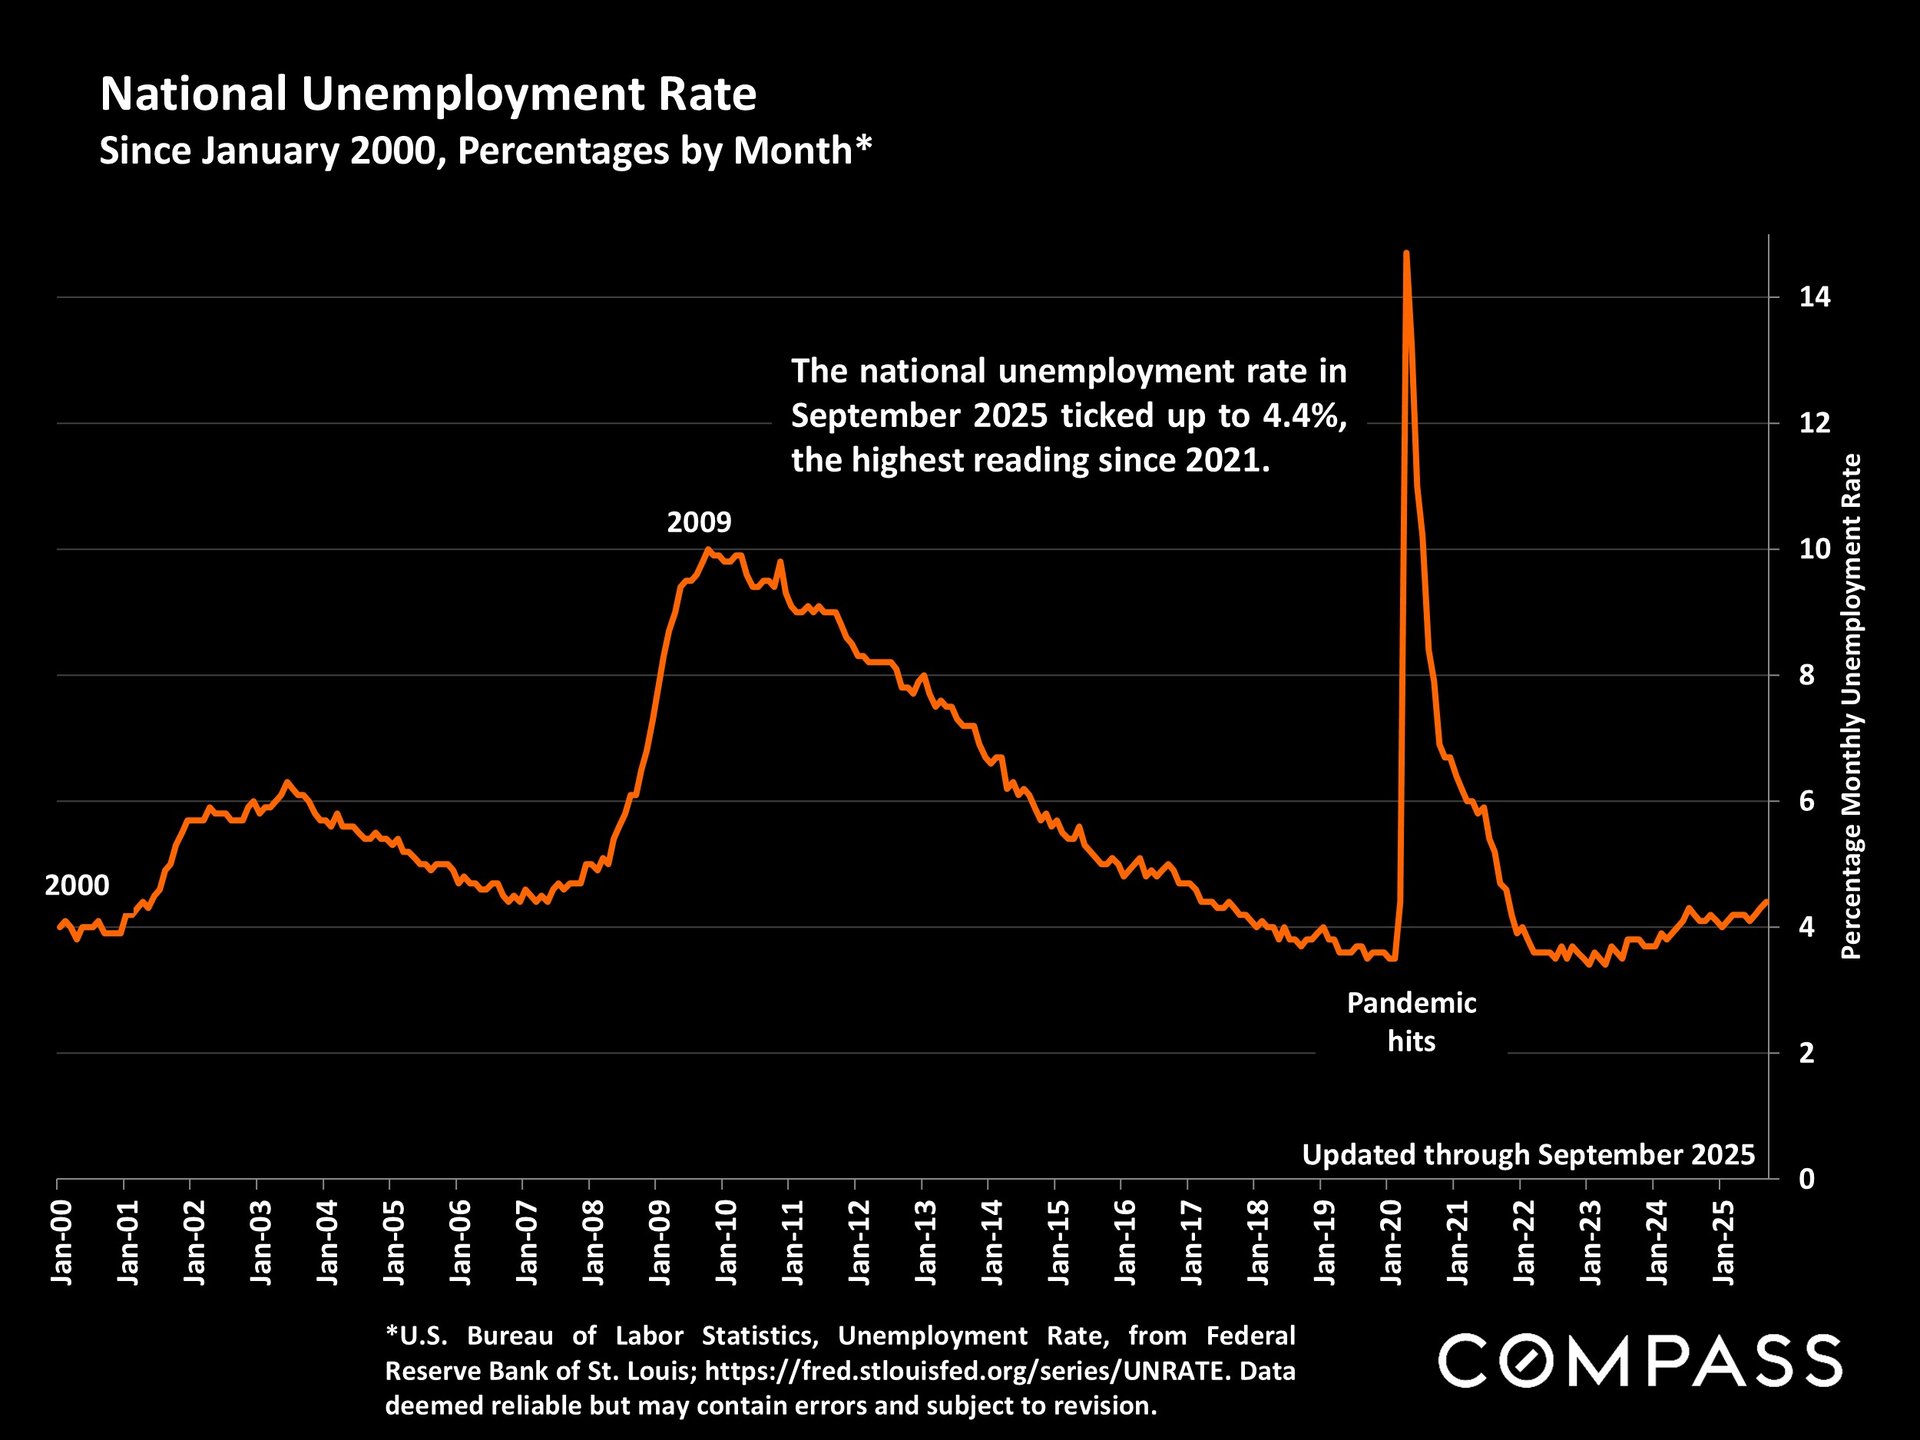
By longer-term standards, the national unemployment rate is not high, but it has been increasing. Employment and unemployment are 2 indicators the Fed takes very seriously while making decisions regarding its benchmark interest rate.
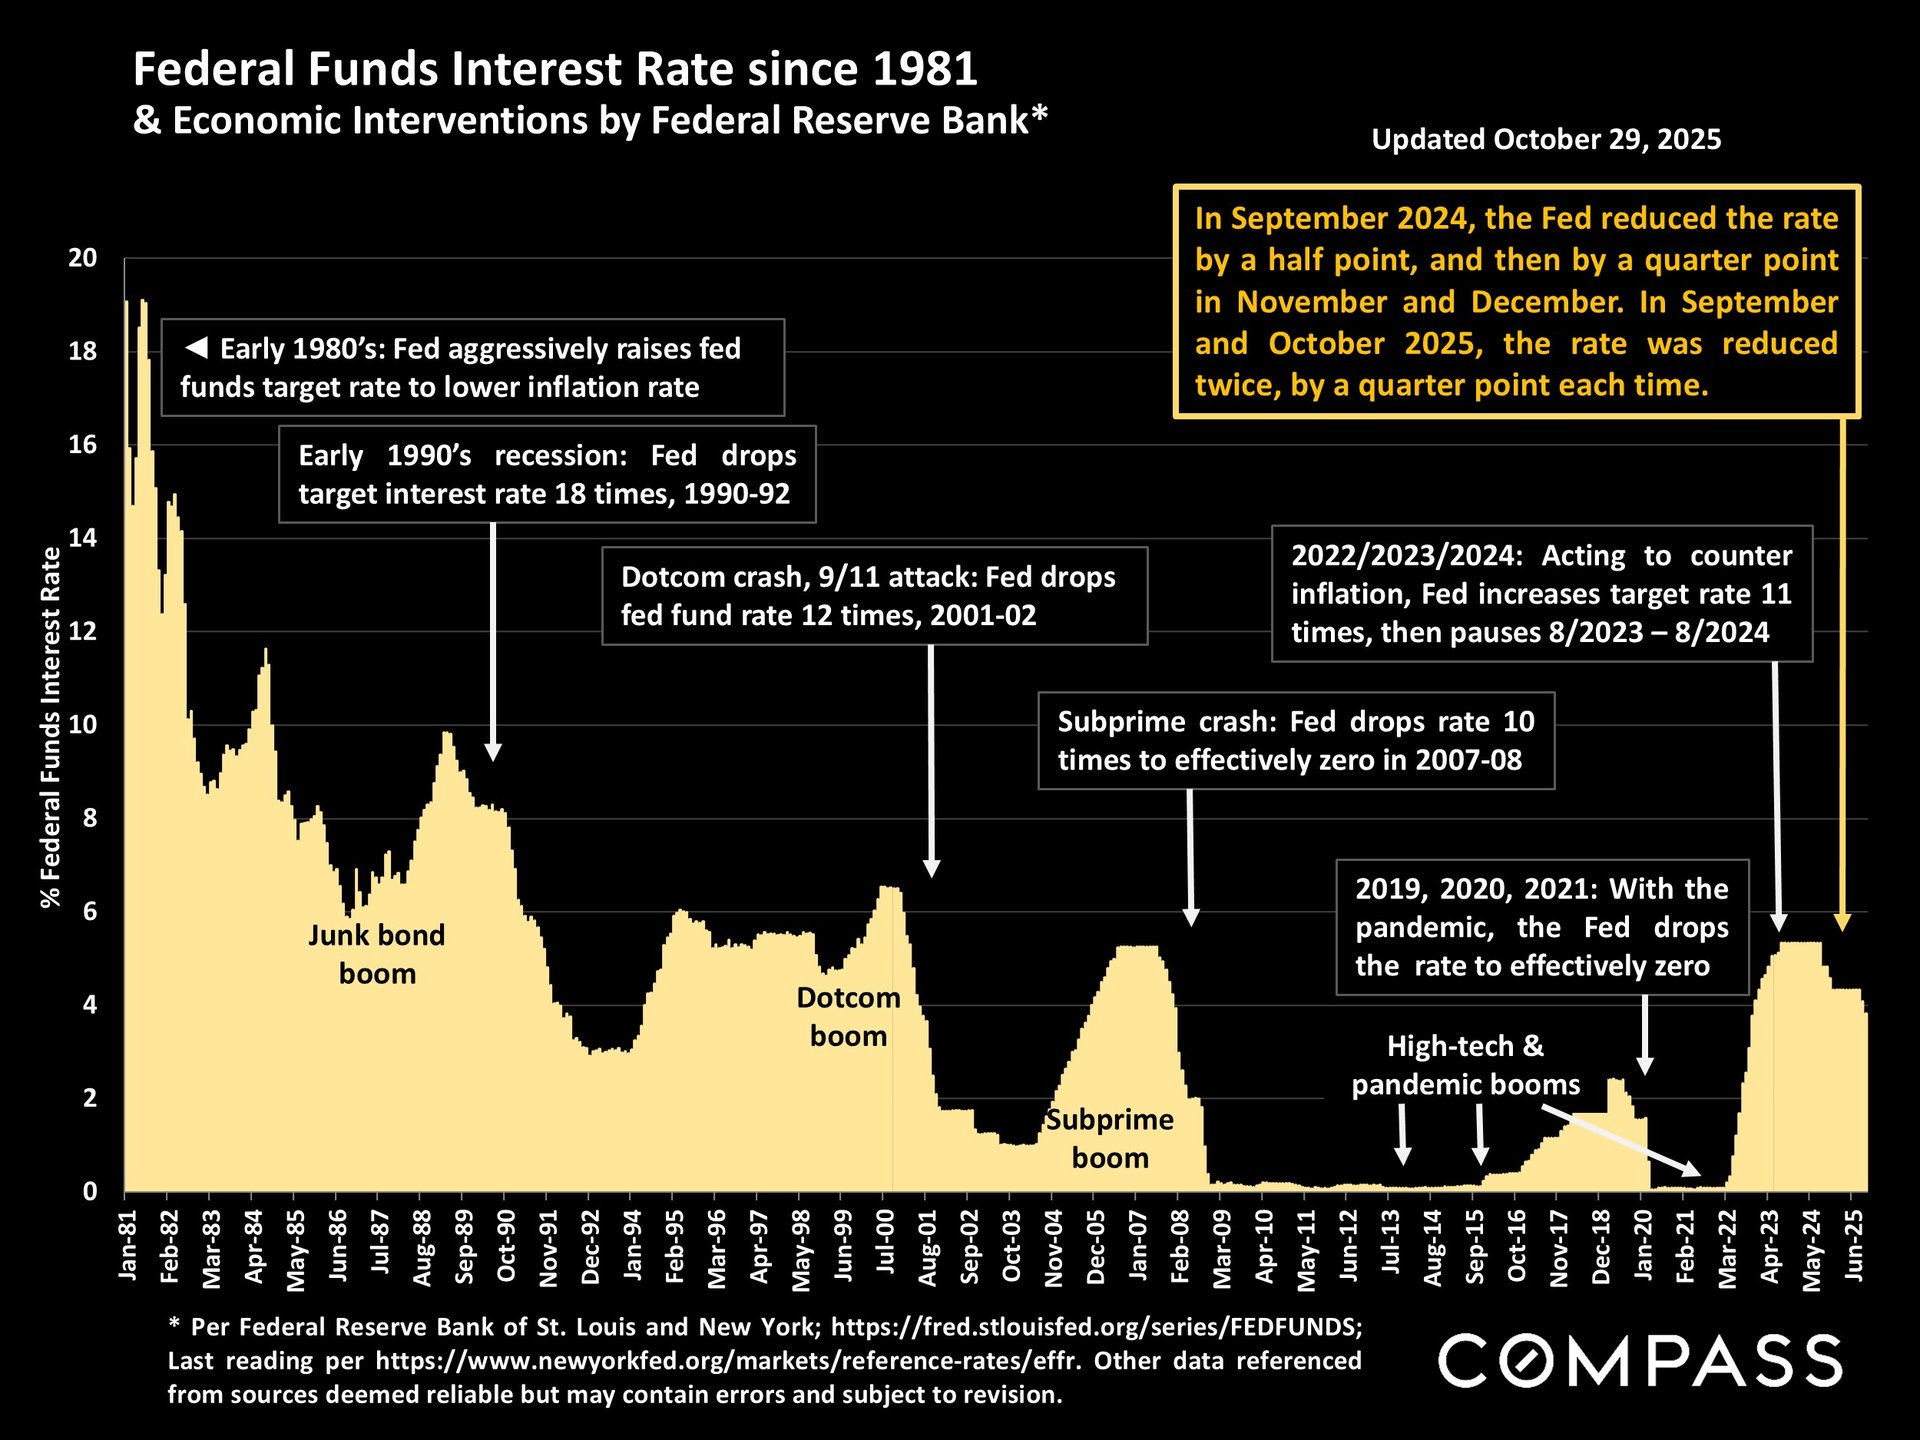
An illustration of all the benchmark-rate changes made by the Fed since 1981. Only 2 small rate reductions occurred so far in 2025, but there is a wide range of predictions as to what the Fed will do in December and 2026. Many economic and political factors are at play in the decision-making.
Stay Informed on the Market
Keeping up with the latest trends and insights in real estate helps you make informed decisions and navigate the market with confidence.
Connect with us to learn more about the market and how it may impact your real estate goals.
(805) 284-3660
[email protected]